
 Yahoo Finance
 Do You Know What Betsson AB's (STO:BETS B) P/E Ratio Means?

Want to participate in a short research study? Help shape the future of investing tools and you could win a $250 gift card!
This article is for investors who would like to improve their understanding of price to earnings ratios (P/E ratios). To keep it practical, we'll show how Betsson AB's (STO:BETS B) P/E ratio could help you assess the value on offer. Based on the last twelve months, Betsson's P/E ratio is 9.25. That is equivalent to an earnings yield of about 11%.
See our latest analysis for Betsson
How Do I Calculate A Price To Earnings Ratio?
The formula for price to earnings is:
Price to Earnings Ratio = Share Price ÷ Earnings per Share (EPS)
Or for Betsson:
P/E of 9.25 = SEK72.08 ÷ SEK7.79 (Based on the trailing twelve months to December 2018.)
Is A High Price-to-Earnings Ratio Good?
A higher P/E ratio means that buyers have to pay a higher price for each SEK1 the company has earned over the last year. All else being equal, it's better to pay a low price -- but as Warren Buffett said, 'It's far better to buy a wonderful company at a fair price than a fair company at a wonderful price.'
How Growth Rates Impact P/E Ratios
Earnings growth rates have a big influence on P/E ratios. That's because companies that grow earnings per share quickly will rapidly increase the 'E' in the equation. And in that case, the P/E ratio itself will drop rather quickly. And as that P/E ratio drops, the company will look cheap, unless its share price increases.
Betsson increased earnings per share by a whopping 37% last year. And its annual EPS growth rate over 5 years is 12%. So we'd generally expect it to have a relatively high P/E ratio.
Does Betsson Have A Relatively High Or Low P/E For Its Industry?
We can get an indication of market expectations by looking at the P/E ratio. If you look at the image below, you can see Betsson has a lower P/E than the average (14.5) in the hospitality industry classification.
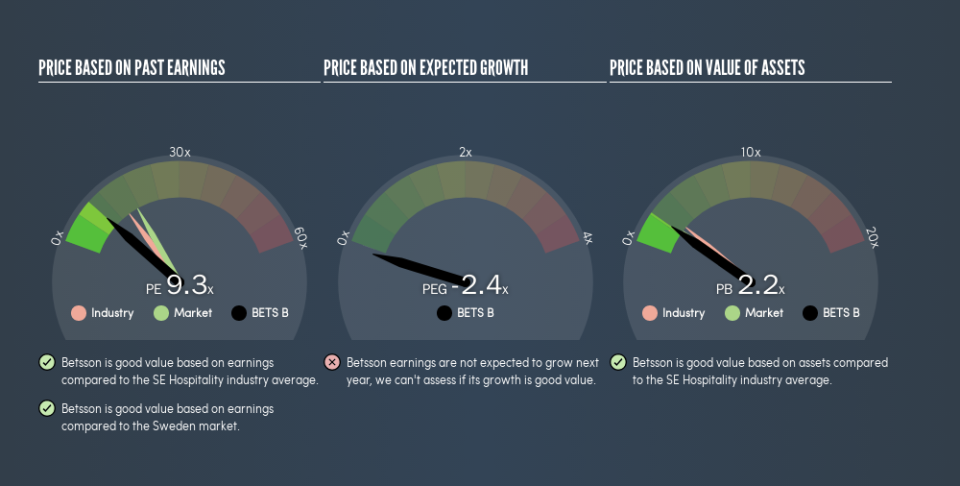
This suggests that market participants think Betsson will underperform other companies in its industry. Since the market seems unimpressed with Betsson, it's quite possible it could surprise on the upside. It is arguably worth checking if insiders are buying shares, because that might imply they believe the stock is undervalued.
Remember: P/E Ratios Don't Consider The Balance Sheet
Don't forget that the P/E ratio considers market capitalization. So it won't reflect the advantage of cash, or disadvantage of debt. Theoretically, a business can improve its earnings (and produce a lower P/E in the future) by investing in growth. That means taking on debt (or spending its cash).
While growth expenditure doesn't always pay off, the point is that it is a good option to have; but one that the P/E ratio ignores.
So What Does Betsson's Balance Sheet Tell Us?
Betsson has net debt worth just 6.0% of its market capitalization. So it doesn't have as many options as it would with net cash, but its debt would not have much of an impact on its P/E ratio.
The Bottom Line On Betsson's P/E Ratio
Betsson's P/E is 9.3 which is below average (17.1) in the SE market. The company hasn't stretched its balance sheet, and earnings growth was good last year. The low P/E ratio suggests current market expectations are muted, implying these levels of growth will not continue.
Investors have an opportunity when market expectations about a stock are wrong. If it is underestimating a company, investors can make money by buying and holding the shares until the market corrects itself. So this free visual report on analyst forecasts could hold the key to an excellent investment decision.
Of course, you might find a fantastic investment by looking at a few good candidates. So take a peek at this free list of companies with modest (or no) debt, trading on a P/E below 20.
We aim to bring you long-term focused research analysis driven by fundamental data. Note that our analysis may not factor in the latest price-sensitive company announcements or qualitative material.
If you spot an error that warrants correction, please contact the editor at editorial-team@simplywallst.com. This article by Simply Wall St is general in nature. It does not constitute a recommendation to buy or sell any stock, and does not take account of your objectives, or your financial situation. Simply Wall St has no position in the stocks mentioned. Thank you for reading.
