
 Yahoo Finance
 What To Know Before Buying AA plc (LON:AA.) For Its Dividend

Dividend paying stocks like AA plc (LON:AA.) tend to be popular with investors, and for good reason - some research suggests a significant amount of all stock market returns come from reinvested dividends. If you are hoping to live on the income from dividends, it's important to be a lot more stringent with your investments than the average punter.
With a four-year payment history and a 4.0% yield, many investors probably find AA intriguing. It sure looks interesting on these metrics - but there's always more to the story . Some simple analysis can reduce the risk of holding AA for its dividend, and we'll focus on the most important aspects below.
Explore this interactive chart for our latest analysis on AA!
Payout ratios
Dividends are usually paid out of company earnings. If a company is paying more than it earns, then the dividend might become unsustainable - hardly an ideal situation. As a result, we should always investigate whether a company can afford its dividend, measured as a percentage of a company's net income after tax. AA paid out 23% of its profit as dividends, over the trailing twelve month period. With a low payout ratio, it looks like the dividend is comprehensively covered by earnings.
In addition to comparing dividends against profits, we should inspect whether the company generated enough cash to pay its dividend. AA's cash payout ratio last year was 5.5%, which is quite low and suggests that the dividend was thoroughly covered by cash flow. It's encouraging to see that the dividend is covered by both profit and cash flow. This generally suggests the dividend is sustainable, as long as earnings don't drop precipitously.
Is AA's Balance Sheet Risky?
As AA has a meaningful amount of debt, we need to check its balance sheet to see if the company might have debt risks. A rough way to check this is with these two simple ratios: a) net debt divided by EBITDA (earnings before interest, tax, depreciation and amortisation), and b) net interest cover. Net debt to EBITDA measures total debt load relative to company earnings (lower = less debt), while net interest cover measures the ability to pay interest on the debt (higher = greater ability to pay interest costs). With a net debt to EBITDA ratio of 10.61 times, AA is very highly levered. While this debt might be serviceable, we would still say it carries substantial risk for the investor who hopes to live on the dividend.
We calculated its interest cover by measuring its earnings before interest and tax (EBIT), and dividing this by the company's net interest expense. Interest cover of 1.49 times its interest expense is starting to become a concern for AA, and be aware that lenders may place additional restrictions on the company as well. High debt and weak interest cover are not a great combo, and we would be cautious of relying on this company's dividend while these metrics persist.
Remember, you can always get a snapshot of AA's latest financial position, by checking our visualisation of its financial health.
Dividend Volatility
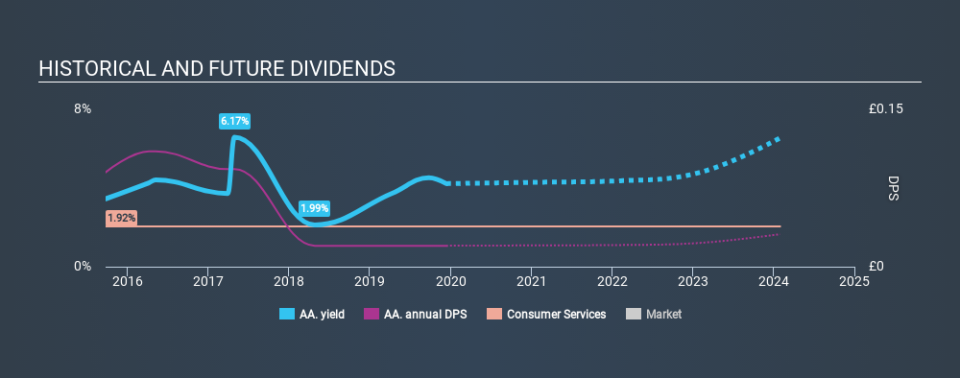
One of the major risks of relying on dividend income, is the potential for a company to struggle financially and cut its dividend. Not only is your income cut, but the value of your investment declines as well - nasty. Looking at the data, we can see that AA has been paying a dividend for the past four years. This company's dividend has been unstable, and with a relatively short history, we think it's a little soon to draw strong conclusions about its long term dividend potential. During the past four-year period, the first annual payment was UK£0.09 in 2015, compared to UK£0.02 last year. This works out to a decline of approximately 78% over that time.
We struggle to make a case for buying AA for its dividend, given that payments have shrunk over the past four years.
Dividend Growth Potential
With a relatively unstable dividend, and a poor history of shrinking dividends, it's even more important to see if EPS are growing. Over the past five years, it looks as though AA's EPS have declined at around 23% a year. A sharp decline in earnings per share is not great from from a dividend perspective, as even conservative payout ratios can come under pressure if earnings fall far enough.
Conclusion
To summarise, shareholders should always check that AA's dividends are affordable, that its dividend payments are relatively stable, and that it has decent prospects for growing its earnings and dividend. First, we like that the company's dividend payments appear well covered, although the retained capital also needs to be effectively reinvested. Second, earnings per share have been in decline, and its dividend has been cut at least once in the past. While we're not hugely bearish on it, overall we think there are potentially better dividend stocks than AA out there.
Given that earnings are not growing, the dividend does not look nearly so attractive. See if the 5 analysts are forecasting a turnaround in our free collection of analyst estimates here.
Looking for more high-yielding dividend ideas? Try our curated list of dividend stocks with a yield above 3%.
If you spot an error that warrants correction, please contact the editor at editorial-team@simplywallst.com. This article by Simply Wall St is general in nature. It does not constitute a recommendation to buy or sell any stock, and does not take account of your objectives, or your financial situation. Simply Wall St has no position in the stocks mentioned.
We aim to bring you long-term focused research analysis driven by fundamental data. Note that our analysis may not factor in the latest price-sensitive company announcements or qualitative material. Thank you for reading.
