
 Yahoo Finance
 What To Know Before Buying Alico, Inc. (NASDAQ:ALCO) For Its Dividend

Is Alico, Inc. (NASDAQ:ALCO) a good dividend stock? How can we tell? Dividend paying companies with growing earnings can be highly rewarding in the long term. Yet sometimes, investors buy a popular dividend stock because of its yield, and then lose money if the company's dividend doesn't live up to expectations.
A slim 1.0% yield is hard to get excited about, but the long payment history is respectable. At the right price, or with strong growth opportunities, Alico could have potential. There are a few simple ways to reduce the risks of buying Alico for its dividend, and we'll go through these below.
Click the interactive chart for our full dividend analysis
Payout ratios
Dividends are usually paid out of company earnings. If a company is paying more than it earns, then the dividend might become unsustainable - hardly an ideal situation. So we need to form a view on if a company's dividend is sustainable, relative to its net profit after tax. In the last year, Alico paid out 4.9% of its profit as dividends. We'd say its dividends are thoroughly covered by earnings.
In addition to comparing dividends against profits, we should inspect whether the company generated enough cash to pay its dividend. Alico's cash payout ratio last year was 5.2%, which is quite low and suggests that the dividend was thoroughly covered by cash flow. It's positive to see that Alico's dividend is covered by both profits and cash flow, since this is generally a sign that the dividend is sustainable, and a lower payout ratio usually suggests a greater margin of safety before the dividend gets cut.
Is Alico's Balance Sheet Risky?
As Alico has a meaningful amount of debt, we need to check its balance sheet to see if the company might have debt risks. A rough way to check this is with these two simple ratios: a) net debt divided by EBITDA (earnings before interest, tax, depreciation and amortisation), and b) net interest cover. Net debt to EBITDA is a measure of a company's total debt. Net interest cover measures the ability to meet interest payments. Essentially we check that a) the company does not have too much debt, and b) that it can afford to pay the interest. With net debt of 2.38 times its EBITDA, Alico has a noticeable amount of debt, although if business stays steady, this may not be overly concerning.
Net interest cover can be calculated by dividing earnings before interest and tax (EBIT) by the company's net interest expense. Net interest cover of 7.22 times its interest expense appears reasonable for Alico, although we're conscious that even high interest cover doesn't make a company bulletproof.
Consider getting our latest analysis on Alico's financial position here.
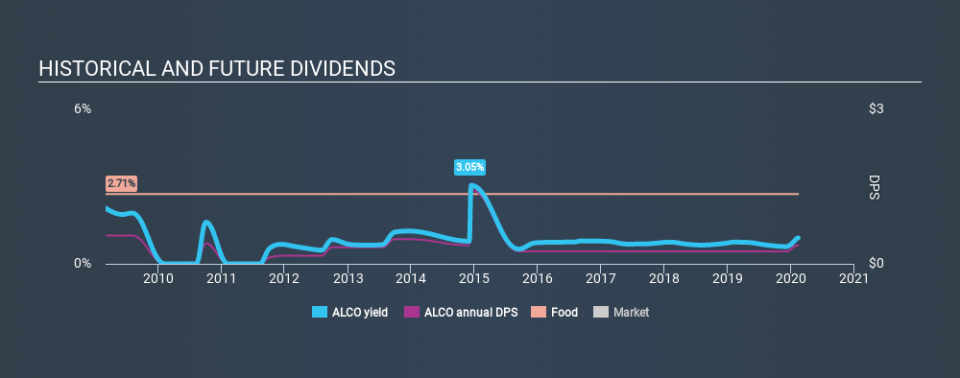
Dividend Volatility
From the perspective of an income investor who wants to earn dividends for many years, there is not much point buying a stock if its dividend is regularly cut or is not reliable. For the purpose of this article, we only scrutinise the last decade of Alico's dividend payments. Its dividend payments have declined on at least one occasion over the past ten years. During the past ten-year period, the first annual payment was US$0.55 in 2010, compared to US$0.36 last year. The dividend has shrunk at around 4.1% a year during that period. Alico's dividend has been cut sharply at least once, so it hasn't fallen by 4.1% every year, but this is a decent approximation of the long term change.
A shrinking dividend over a ten-year period is not ideal, and we'd be concerned about investing in a dividend stock that lacks a solid record of growing dividends per share.
Dividend Growth Potential
Given that the dividend has been cut in the past, we need to check if earnings are growing and if that might lead to stronger dividends in the future. Strong earnings per share (EPS) growth might encourage our interest in the company despite fluctuating dividends, which is why it's great to see Alico has grown its earnings per share at 34% per annum over the past five years. Earnings per share have grown rapidly, and the company is retaining a majority of its earnings. We think this is ideal from an investment perspective, if the company is able to reinvest these earnings effectively.
Conclusion
To summarise, shareholders should always check that Alico's dividends are affordable, that its dividend payments are relatively stable, and that it has decent prospects for growing its earnings and dividend. It's great to see that Alico is paying out a low percentage of its earnings and cash flow. Next, earnings growth has been good, but unfortunately the dividend has been cut at least once in the past. Overall we think Alico scores well on our analysis. It's not quite perfect, but we'd definitely be keen to take a closer look.
You can also discover whether shareholders are aligned with insider interests by checking our visualisation of insider shareholdings and trades in Alico stock.
If you are a dividend investor, you might also want to look at our curated list of dividend stocks yielding above 3%.
If you spot an error that warrants correction, please contact the editor at editorial-team@simplywallst.com. This article by Simply Wall St is general in nature. It does not constitute a recommendation to buy or sell any stock, and does not take account of your objectives, or your financial situation. Simply Wall St has no position in the stocks mentioned.
We aim to bring you long-term focused research analysis driven by fundamental data. Note that our analysis may not factor in the latest price-sensitive company announcements or qualitative material. Thank you for reading.
