
 Yahoo Finance
 What You Should Know About Conduent Incorporated's (NYSE:CNDT) Financial Strength

Want to participate in a short research study? Help shape the future of investing tools and you could win a $250 gift card!
While small-cap stocks, such as Conduent Incorporated (NYSE:CNDT) with its market cap of US$2.8b, are popular for their explosive growth, investors should also be aware of their balance sheet to judge whether the company can survive a downturn. Since CNDT is loss-making right now, it’s vital to evaluate the current state of its operations and pathway to profitability. We'll look at some basic checks that can form a snapshot the company’s financial strength. However, this is not a comprehensive overview, so I recommend you dig deeper yourself into CNDT here.
Does CNDT Produce Much Cash Relative To Its Debt?
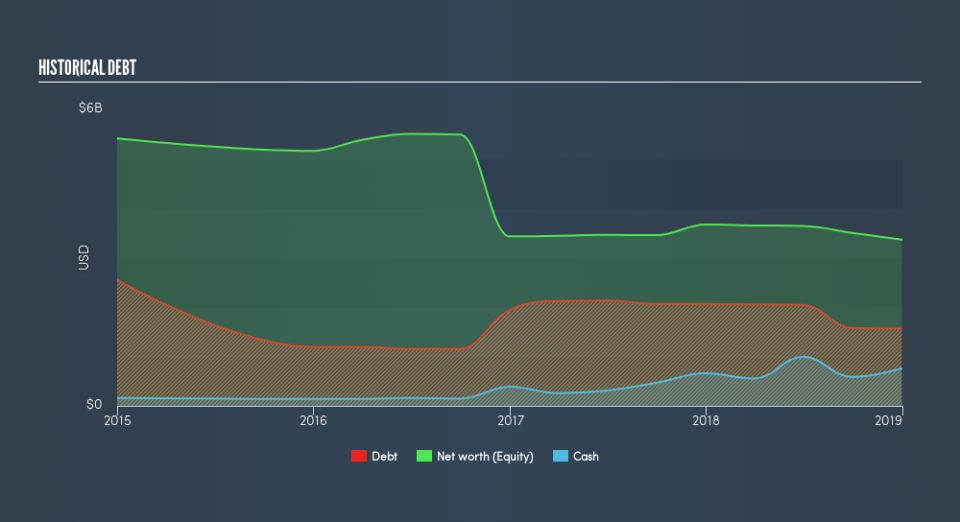
Over the past year, CNDT has reduced its debt from US$2.1b to US$1.6b , which also accounts for long term debt. With this debt repayment, CNDT currently has US$756m remaining in cash and short-term investments , ready to be used for running the business. Moreover, CNDT has generated cash from operations of US$283m in the last twelve months, leading to an operating cash to total debt ratio of 18%, signalling that CNDT’s current level of operating cash is not high enough to cover debt.
Does CNDT’s liquid assets cover its short-term commitments?
With current liabilities at US$1.2b, it appears that the company has been able to meet these commitments with a current assets level of US$2.0b, leading to a 1.64x current account ratio. The current ratio is calculated by dividing current assets by current liabilities. Generally, for IT companies, this is a reasonable ratio since there's a sufficient cash cushion without leaving too much capital idle or in low-earning investments.
Does CNDT face the risk of succumbing to its debt-load?
With a debt-to-equity ratio of 47%, CNDT can be considered as an above-average leveraged company. This is somewhat unusual for small-caps companies, since lenders are often hesitant to provide attractive interest rates to less-established businesses. Though, since CNDT is currently loss-making, there’s a question of sustainability of its current operations. Maintaining a high level of debt, while revenues are still below costs, can be dangerous as liquidity tends to dry up in unexpected downturns.
Next Steps:
CNDT’s high cash coverage means that, although its debt levels are high, the company is able to utilise its borrowings efficiently in order to generate cash flow. Since there is also no concerns around CNDT's liquidity needs, this may be its optimal capital structure for the time being. This is only a rough assessment of financial health, and I'm sure CNDT has company-specific issues impacting its capital structure decisions. I suggest you continue to research Conduent to get a more holistic view of the small-cap by looking at:
Future Outlook: What are well-informed industry analysts predicting for CNDT’s future growth? Take a look at our free research report of analyst consensus for CNDT’s outlook.
Valuation: What is CNDT worth today? Is the stock undervalued, even when its growth outlook is factored into its intrinsic value? The intrinsic value infographic in our free research report helps visualize whether CNDT is currently mispriced by the market.
Other High-Performing Stocks: Are there other stocks that provide better prospects with proven track records? Explore our free list of these great stocks here.
We aim to bring you long-term focused research analysis driven by fundamental data. Note that our analysis may not factor in the latest price-sensitive company announcements or qualitative material.
If you spot an error that warrants correction, please contact the editor at editorial-team@simplywallst.com. This article by Simply Wall St is general in nature. It does not constitute a recommendation to buy or sell any stock, and does not take account of your objectives, or your financial situation. Simply Wall St has no position in the stocks mentioned. Thank you for reading.
