
 Yahoo Finance
 Do You Know What Daejan Holdings Plc's (LON:DJAN) P/E Ratio Means?

The goal of this article is to teach you how to use price to earnings ratios (P/E ratios). We'll show how you can use Daejan Holdings Plc's (LON:DJAN) P/E ratio to inform your assessment of the investment opportunity. Daejan Holdings has a price to earnings ratio of 6.65, based on the last twelve months. That means that at current prices, buyers pay £6.65 for every £1 in trailing yearly profits.
See our latest analysis for Daejan Holdings
How Do You Calculate A P/E Ratio?
The formula for price to earnings is:
Price to Earnings Ratio = Price per Share ÷ Earnings per Share (EPS)
Or for Daejan Holdings:
P/E of 6.65 = £48.90 ÷ £7.36 (Based on the trailing twelve months to March 2019.)
Is A High Price-to-Earnings Ratio Good?
The higher the P/E ratio, the higher the price tag of a business, relative to its trailing earnings. All else being equal, it's better to pay a low price -- but as Warren Buffett said, 'It's far better to buy a wonderful company at a fair price than a fair company at a wonderful price.
Does Daejan Holdings Have A Relatively High Or Low P/E For Its Industry?
One good way to get a quick read on what market participants expect of a company is to look at its P/E ratio. The image below shows that Daejan Holdings has a lower P/E than the average (13.2) P/E for companies in the real estate industry.
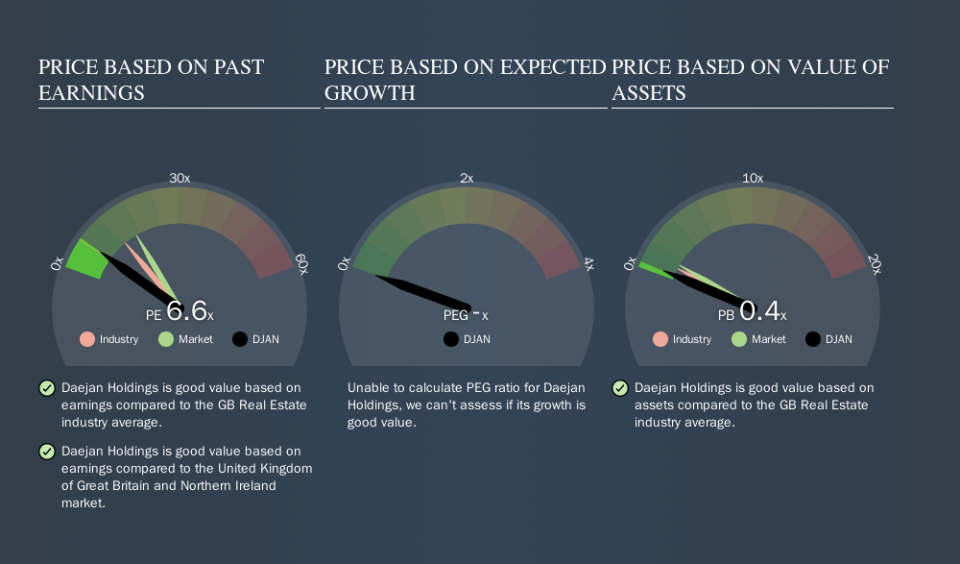
This suggests that market participants think Daejan Holdings will underperform other companies in its industry. Since the market seems unimpressed with Daejan Holdings, it's quite possible it could surprise on the upside. It is arguably worth checking if insiders are buying shares, because that might imply they believe the stock is undervalued.
How Growth Rates Impact P/E Ratios
When earnings fall, the 'E' decreases, over time. That means unless the share price falls, the P/E will increase in a few years. A higher P/E should indicate the stock is expensive relative to others -- and that may encourage shareholders to sell.
Daejan Holdings saw earnings per share decrease by 41% last year. And it has shrunk its earnings per share by 4.4% per year over the last five years. This growth rate might warrant a below average P/E ratio.
A Limitation: P/E Ratios Ignore Debt and Cash In The Bank
It's important to note that the P/E ratio considers the market capitalization, not the enterprise value. Thus, the metric does not reflect cash or debt held by the company. Hypothetically, a company could reduce its future P/E ratio by spending its cash (or taking on debt) to achieve higher earnings.
Such spending might be good or bad, overall, but the key point here is that you need to look at debt to understand the P/E ratio in context.
How Does Daejan Holdings's Debt Impact Its P/E Ratio?
Daejan Holdings's net debt equates to 42% of its market capitalization. You'd want to be aware of this fact, but it doesn't bother us.
The Bottom Line On Daejan Holdings's P/E Ratio
Daejan Holdings's P/E is 6.6 which is below average (16.9) in the GB market. Since it only carries a modest debt load, it's likely the low expectations implied by the P/E ratio arise from the lack of recent earnings growth.
Investors should be looking to buy stocks that the market is wrong about. As value investor Benjamin Graham famously said, 'In the short run, the market is a voting machine but in the long run, it is a weighing machine. Although we don't have analyst forecasts shareholders might want to examine this detailed historical graph of earnings, revenue and cash flow.
Of course, you might find a fantastic investment by looking at a few good candidates. So take a peek at this free list of companies with modest (or no) debt, trading on a P/E below 20.
We aim to bring you long-term focused research analysis driven by fundamental data. Note that our analysis may not factor in the latest price-sensitive company announcements or qualitative material.
If you spot an error that warrants correction, please contact the editor at editorial-team@simplywallst.com. This article by Simply Wall St is general in nature. It does not constitute a recommendation to buy or sell any stock, and does not take account of your objectives, or your financial situation. Simply Wall St has no position in the stocks mentioned. Thank you for reading.
