
 Yahoo Finance
 Do You Know What Enerplus Corporation's (TSE:ERF) P/E Ratio Means?

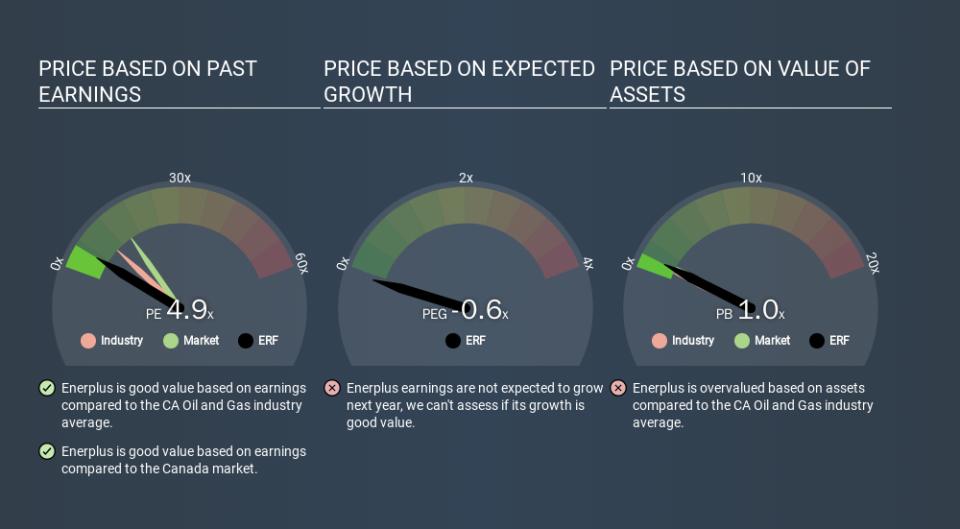
This article is written for those who want to get better at using price to earnings ratios (P/E ratios). To keep it practical, we'll show how Enerplus Corporation's (TSE:ERF) P/E ratio could help you assess the value on offer. Based on the last twelve months, Enerplus's P/E ratio is 4.85. That is equivalent to an earnings yield of about 20.6%.
Check out our latest analysis for Enerplus
How Do I Calculate A Price To Earnings Ratio?
The formula for P/E is:
Price to Earnings Ratio = Share Price ÷ Earnings per Share (EPS)
Or for Enerplus:
P/E of 4.85 = CA$8.60 ÷ CA$1.77 (Based on the trailing twelve months to September 2019.)
Is A High P/E Ratio Good?
The higher the P/E ratio, the higher the price tag of a business, relative to its trailing earnings. That isn't a good or a bad thing on its own, but a high P/E means that buyers have a higher opinion of the business's prospects, relative to stocks with a lower P/E.
Does Enerplus Have A Relatively High Or Low P/E For Its Industry?
The P/E ratio indicates whether the market has higher or lower expectations of a company. If you look at the image below, you can see Enerplus has a lower P/E than the average (10.8) in the oil and gas industry classification.
Its relatively low P/E ratio indicates that Enerplus shareholders think it will struggle to do as well as other companies in its industry classification. Since the market seems unimpressed with Enerplus, it's quite possible it could surprise on the upside. If you consider the stock interesting, further research is recommended. For example, I often monitor director buying and selling.
How Growth Rates Impact P/E Ratios
P/E ratios primarily reflect market expectations around earnings growth rates. If earnings are growing quickly, then the 'E' in the equation will increase faster than it would otherwise. That means even if the current P/E is high, it will reduce over time if the share price stays flat. Then, a lower P/E should attract more buyers, pushing the share price up.
In the last year, Enerplus grew EPS like Taylor Swift grew her fan base back in 2010; the 200% gain was both fast and well deserved. The cherry on top is that the five year growth rate was an impressive 15% per year. So I'd be surprised if the P/E ratio was not above average.
Remember: P/E Ratios Don't Consider The Balance Sheet
The 'Price' in P/E reflects the market capitalization of the company. Thus, the metric does not reflect cash or debt held by the company. In theory, a company can lower its future P/E ratio by using cash or debt to invest in growth.
Spending on growth might be good or bad a few years later, but the point is that the P/E ratio does not account for the option (or lack thereof).
Is Debt Impacting Enerplus's P/E?
Enerplus's net debt equates to 29% of its market capitalization. You'd want to be aware of this fact, but it doesn't bother us.
The Bottom Line On Enerplus's P/E Ratio
Enerplus's P/E is 4.9 which is below average (15.3) in the CA market. The EPS growth last year was strong, and debt levels are quite reasonable. If the company can continue to grow earnings, then the current P/E may be unjustifiably low.
When the market is wrong about a stock, it gives savvy investors an opportunity. If it is underestimating a company, investors can make money by buying and holding the shares until the market corrects itself. So this free visualization of the analyst consensus on future earnings could help you make the right decision about whether to buy, sell, or hold.
Of course you might be able to find a better stock than Enerplus. So you may wish to see this free collection of other companies that have grown earnings strongly.
If you spot an error that warrants correction, please contact the editor at editorial-team@simplywallst.com. This article by Simply Wall St is general in nature. It does not constitute a recommendation to buy or sell any stock, and does not take account of your objectives, or your financial situation. Simply Wall St has no position in the stocks mentioned.
We aim to bring you long-term focused research analysis driven by fundamental data. Note that our analysis may not factor in the latest price-sensitive company announcements or qualitative material. Thank you for reading.
