
 Yahoo Finance
 All You Need To Know About Floor & Decor Holdings Inc’s (NYSE:FND) Financial Health

Small-caps and large-caps are wildly popular among investors; however, mid-cap stocks, such as Floor & Decor Holdings Inc (NYSE:FND) with a market-capitalization of US$4.87b, rarely draw their attention. However, generally ignored mid-caps have historically delivered better risk adjusted returns than both of those groups. This article will examine FND’s financial liquidity and debt levels to get an idea of whether the company can deal with cyclical downturns and maintain funds to accommodate strategic spending for future growth. Note that this information is centred entirely on financial health and is a top-level understanding, so I encourage you to look further into FND here. Check out our latest analysis for Floor & Decor Holdings
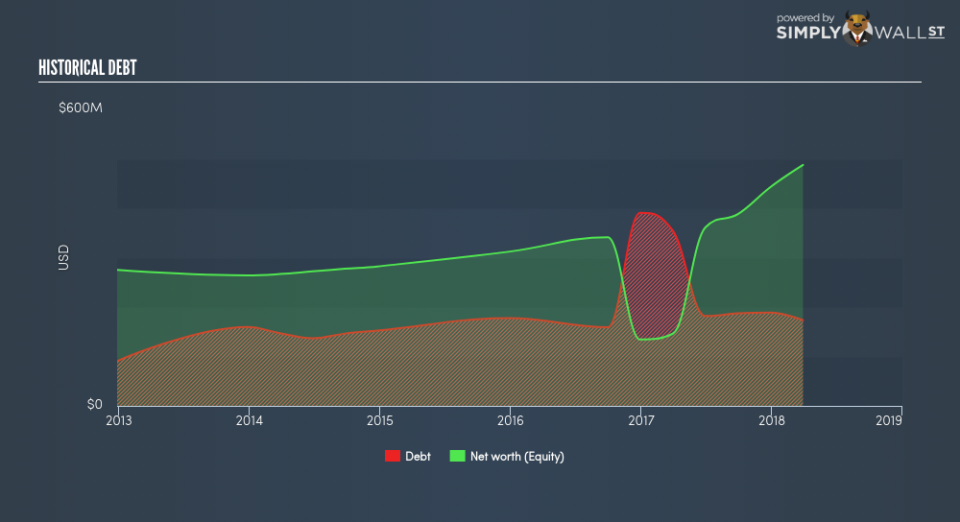
Does FND produce enough cash relative to debt?
FND’s debt levels have fallen from US$390.74m to US$189.06m over the last 12 months , which is made up of current and long term debt. With this reduction in debt, FND currently has US$556.00k remaining in cash and short-term investments , ready to deploy into the business. On top of this, FND has generated US$109.21m in operating cash flow during the same period of time, resulting in an operating cash to total debt ratio of 57.76%, meaning that FND’s operating cash is sufficient to cover its debt. This ratio can also be a sign of operational efficiency as an alternative to return on assets. In FND’s case, it is able to generate 0.58x cash from its debt capital.
Can FND pay its short-term liabilities?
Looking at FND’s most recent US$359.30m liabilities, it seems that the business has been able to meet these obligations given the level of current assets of US$503.21m, with a current ratio of 1.4x. Usually, for Specialty Retail companies, this is a suitable ratio as there’s enough of a cash buffer without holding too capital in low return investments.
Can FND service its debt comfortably?
With a debt-to-equity ratio of 35.54%, FND’s debt level may be seen as prudent. FND is not taking on too much debt commitment, which can be restrictive and risky for equity-holders. We can check to see whether FND is able to meet its debt obligations by looking at the net interest coverage ratio. A company generating earnings before interest and tax (EBIT) at least three times its net interest payments is considered financially sound. In FND’s, case, the ratio of 12.97x suggests that interest is comfortably covered, which means that debtors may be willing to loan the company more money, giving FND ample headroom to grow its debt facilities.
Next Steps:
FND’s debt level is appropriate for a company its size, and it is also able to generate sufficient cash flow coverage, meaning it has been able to put its debt in good use. Furthermore, the company exhibits proper management of current assets and upcoming liabilities. Keep in mind I haven’t considered other factors such as how FND has been performing in the past. You should continue to research Floor & Decor Holdings to get a more holistic view of the stock by looking at:
Future Outlook: What are well-informed industry analysts predicting for FND’s future growth? Take a look at our free research report of analyst consensus for FND’s outlook.
Valuation: What is FND worth today? Is the stock undervalued, even when its growth outlook is factored into its intrinsic value? The intrinsic value infographic in our free research report helps visualize whether FND is currently mispriced by the market.
Other High-Performing Stocks: Are there other stocks that provide better prospects with proven track records? Explore our free list of these great stocks here.
To help readers see pass the short term volatility of the financial market, we aim to bring you a long-term focused research analysis purely driven by fundamental data. Note that our analysis does not factor in the latest price sensitive company announcements.
The author is an independent contributor and at the time of publication had no position in the stocks mentioned.