
 Yahoo Finance
 Do You Know About Goodwin plc’s (LON:GDWN) ROCE?

Today we’ll look at Goodwin plc (LON:GDWN) and reflect on its potential as an investment. To be precise, we’ll consider its Return On Capital Employed (ROCE), as that will inform our view of the quality of the business.
First of all, we’ll work out how to calculate ROCE. Second, we’ll look at its ROCE compared to similar companies. Finally, we’ll look at how its current liabilities affect its ROCE.
Return On Capital Employed (ROCE): What is it?
ROCE measures the amount of pre-tax profits a company can generate from the capital employed in its business. All else being equal, a better business will have a higher ROCE. Ultimately, it is a useful but imperfect metric. Author Edwin Whiting says to be careful when comparing the ROCE of different businesses, since ‘No two businesses are exactly alike.’
How Do You Calculate Return On Capital Employed?
Analysts use this formula to calculate return on capital employed:
Return on Capital Employed = Earnings Before Interest and Tax (EBIT) ÷ (Total Assets – Current Liabilities)
Or for Goodwin:
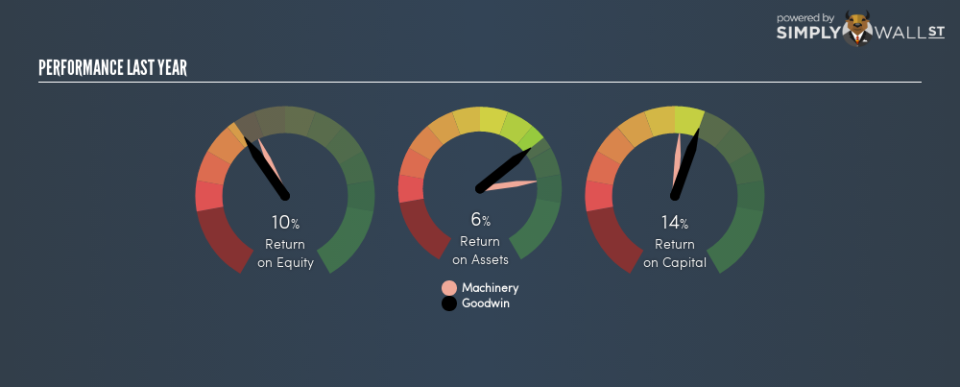
0.14 = UK£14m ÷ (UK£168m – UK£52m) (Based on the trailing twelve months to October 2018.)
Therefore, Goodwin has an ROCE of 14%.
Check out our latest analysis for Goodwin
Is Goodwin’s ROCE Good?
When making comparisons between similar businesses, investors may find ROCE useful. We can see Goodwin’s ROCE is around the 13% average reported by the Machinery industry. Separate from Goodwin’s performance relative to its industry, its ROCE in absolute terms looks satisfactory, and it may be worth researching in more depth.
Remember that this metric is backwards looking – it shows what has happened in the past, and does not accurately predict the future. Companies in cyclical industries can be difficult to understand using ROCE, as returns typically look high during boom times, and low during busts. This is because ROCE only looks at one year, instead of considering returns across a whole cycle. You can check if Goodwin has cyclical profits by looking at this free graph of past earnings, revenue and cash flow.
How Goodwin’s Current Liabilities Impact Its ROCE
Current liabilities are short term bills and invoices that need to be paid in 12 months or less. Due to the way ROCE is calculated, a high level of current liabilities makes a company look as though it has less capital employed, and thus can (sometimes unfairly) boost the ROCE. To counteract this, we check if a company has high current liabilities, relative to its total assets.
Goodwin has total assets of UK£168m and current liabilities of UK£52m. Therefore its current liabilities are equivalent to approximately 31% of its total assets. With this level of current liabilities, Goodwin’s ROCE is boosted somewhat.
Our Take On Goodwin’s ROCE
While its ROCE looks good, it’s worth remembering that the current liabilities are making the business look better. But note: Goodwin may not be the best stock to buy. So take a peek at this free list of interesting companies with strong recent earnings growth (and a P/E ratio below 20).
If you like to buy stocks alongside management, then you might just love this free list of companies. (Hint: insiders have been buying them).
To help readers see past the short term volatility of the financial market, we aim to bring you a long-term focused research analysis purely driven by fundamental data. Note that our analysis does not factor in the latest price-sensitive company announcements.
The author is an independent contributor and at the time of publication had no position in the stocks mentioned. For errors that warrant correction please contact the editor at editorial-team@simplywallst.com.
