
 Yahoo Finance
 Do You Know What Griffin Mining Limited’s (LON:GFM) P/E Ratio Means?

This article is written for those who want to get better at using price to earnings ratios (P/E ratios). To keep it practical, we’ll show how Griffin Mining Limited’s (LON:GFM) P/E ratio could help you assess the value on offer. Based on the last twelve months, Griffin Mining’s P/E ratio is 5.37. That corresponds to an earnings yield of approximately 19%.
View our latest analysis for Griffin Mining
How Do You Calculate A P/E Ratio?
The formula for P/E is:
Price to Earnings Ratio = Price per Share (in the reporting currency) ÷ Earnings per Share (EPS)
Or for Griffin Mining:
P/E of 5.37 = $1.34 (Note: this is the share price in the reporting currency, namely, USD ) ÷ $0.25 (Based on the year to June 2018.)
Is A High P/E Ratio Good?
A higher P/E ratio means that buyers have to pay a higher price for each £1 the company has earned over the last year. That isn’t necessarily good or bad, but a high P/E implies relatively high expectations of what a company can achieve in the future.
How Growth Rates Impact P/E Ratios
Earnings growth rates have a big influence on P/E ratios. That’s because companies that grow earnings per share quickly will rapidly increase the ‘E’ in the equation. That means even if the current P/E is high, it will reduce over time if the share price stays flat. So while a stock may look expensive based on past earnings, it could be cheap based on future earnings.
Griffin Mining increased earnings per share by a whopping 71% last year. And earnings per share have improved by 50% annually, over the last five years. I’d therefore be a little surprised if its P/E ratio was not relatively high.
How Does Griffin Mining’s P/E Ratio Compare To Its Peers?
The P/E ratio essentially measures market expectations of a company. We can see in the image below that the average P/E (9.1) for companies in the metals and mining industry is higher than Griffin Mining’s P/E.
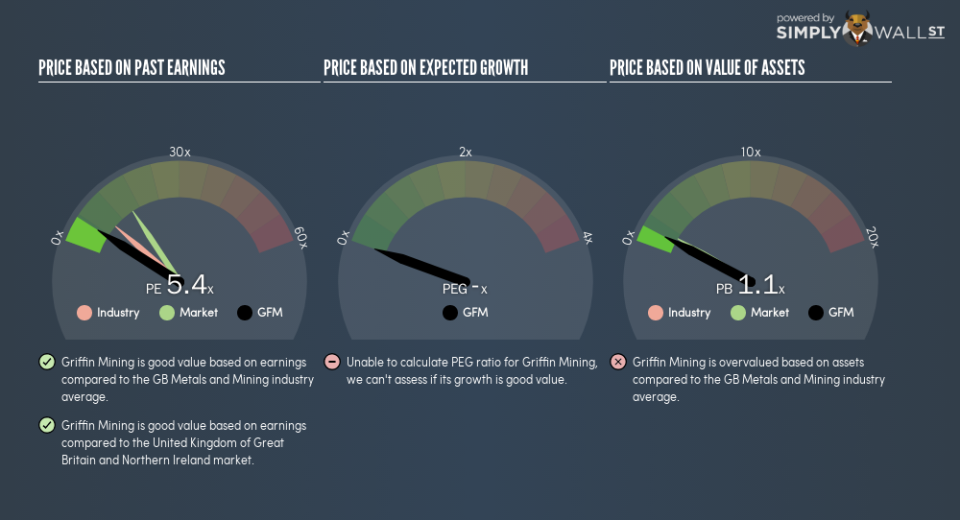
This suggests that market participants think Griffin Mining will underperform other companies in its industry. Since the market seems unimpressed with Griffin Mining, it’s quite possible it could surprise on the upside. It is arguably worth checking if insiders are buying shares, because that might imply they believe the stock is undervalued.
A Limitation: P/E Ratios Ignore Debt and Cash In The Bank
Don’t forget that the P/E ratio considers market capitalization. Thus, the metric does not reflect cash or debt held by the company. Theoretically, a business can improve its earnings (and produce a lower P/E in the future), by taking on debt (or spending its remaining cash).
Such spending might be good or bad, overall, but the key point here is that you need to look at debt to understand the P/E ratio in context.
Griffin Mining’s Balance Sheet
Griffin Mining has net cash of US$25m. That should lead to a higher P/E than if it did have debt, because its strong balance sheets gives it more options.
The Verdict On Griffin Mining’s P/E Ratio
Griffin Mining trades on a P/E ratio of 5.4, which is below the GB market average of 15.7. It grew its EPS nicely over the last year, and the healthy balance sheet implies there is more potential for growth. The below average P/E ratio suggests that market participants don’t believe the strong growth will continue.
Investors have an opportunity when market expectations about a stock are wrong. If the reality for a company is not as bad as the P/E ratio indicates, then the share price should increase as the market realizes this. So this free visualization of the analyst consensus on future earnings could help you make the right decision about whether to buy, sell, or hold.
Of course, you might find a fantastic investment by looking at a few good candidates. So take a peek at this free list of companies with modest (or no) debt, trading on a P/E below 20.
To help readers see past the short term volatility of the financial market, we aim to bring you a long-term focused research analysis purely driven by fundamental data. Note that our analysis does not factor in the latest price-sensitive company announcements.
The author is an independent contributor and at the time of publication had no position in the stocks mentioned. For errors that warrant correction please contact the editor at editorial-team@simplywallst.com.
