
 Yahoo Finance
 Do You Know What Lithia Motors, Inc.'s (NYSE:LAD) P/E Ratio Means?

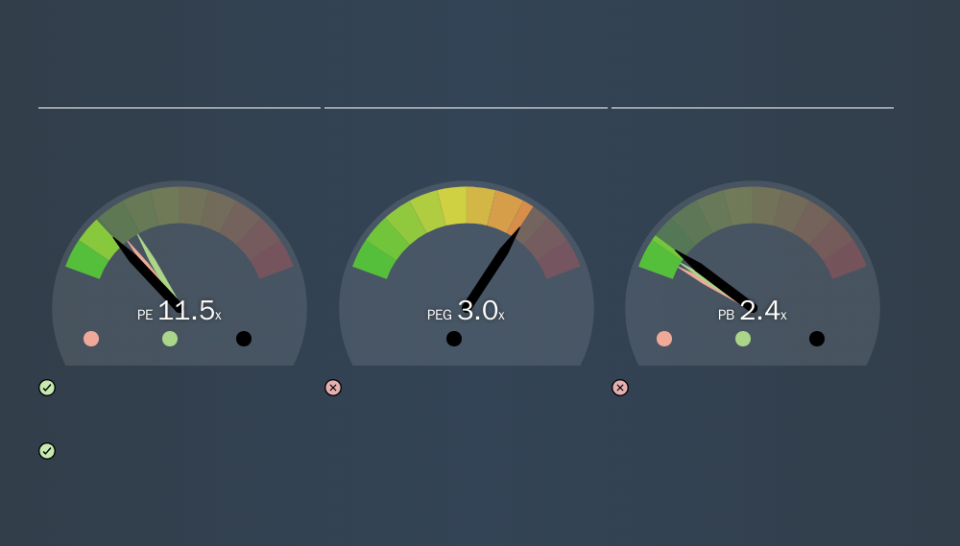
Today, we'll introduce the concept of the P/E ratio for those who are learning about investing. We'll look at Lithia Motors, Inc.'s (NYSE:LAD) P/E ratio and reflect on what it tells us about the company's share price. What is Lithia Motors's P/E ratio? Well, based on the last twelve months it is 11.49. That means that at current prices, buyers pay $11.49 for every $1 in trailing yearly profits.
See our latest analysis for Lithia Motors
How Do I Calculate A Price To Earnings Ratio?
The formula for P/E is:
Price to Earnings Ratio = Price per Share ÷ Earnings per Share (EPS)
Or for Lithia Motors:
P/E of 11.49 = $132.42 ÷ $11.52 (Based on the year to June 2019.)
Is A High P/E Ratio Good?
The higher the P/E ratio, the higher the price tag of a business, relative to its trailing earnings. That is not a good or a bad thing per se, but a high P/E does imply buyers are optimistic about the future.
Does Lithia Motors Have A Relatively High Or Low P/E For Its Industry?
One good way to get a quick read on what market participants expect of a company is to look at its P/E ratio. We can see in the image below that the average P/E (14.4) for companies in the specialty retail industry is higher than Lithia Motors's P/E.
This suggests that market participants think Lithia Motors will underperform other companies in its industry. Since the market seems unimpressed with Lithia Motors, it's quite possible it could surprise on the upside. You should delve deeper. I like to check if company insiders have been buying or selling.
How Growth Rates Impact P/E Ratios
Probably the most important factor in determining what P/E a company trades on is the earnings growth. Earnings growth means that in the future the 'E' will be higher. That means unless the share price increases, the P/E will reduce in a few years. So while a stock may look expensive based on past earnings, it could be cheap based on future earnings.
Lithia Motors increased earnings per share by an impressive 13% over the last twelve months. And it has bolstered its earnings per share by 20% per year over the last five years. So one might expect an above average P/E ratio.
Remember: P/E Ratios Don't Consider The Balance Sheet
Don't forget that the P/E ratio considers market capitalization. That means it doesn't take debt or cash into account. Theoretically, a business can improve its earnings (and produce a lower P/E in the future) by investing in growth. That means taking on debt (or spending its cash).
Such spending might be good or bad, overall, but the key point here is that you need to look at debt to understand the P/E ratio in context.
Lithia Motors's Balance Sheet
Lithia Motors's net debt is considerable, at 111% of its market cap. This is a relatively high level of debt, so the stock probably deserves a relatively low P/E ratio. Keep that in mind when comparing it to other companies.
The Bottom Line On Lithia Motors's P/E Ratio
Lithia Motors's P/E is 11.5 which is below average (17.5) in the US market. The company has a meaningful amount of debt on the balance sheet, but that should not eclipse the solid earnings growth. The low P/E ratio suggests current market expectations are muted, implying these levels of growth will not continue.
Investors have an opportunity when market expectations about a stock are wrong. As value investor Benjamin Graham famously said, 'In the short run, the market is a voting machine but in the long run, it is a weighing machine.' So this free report on the analyst consensus forecasts could help you make a master move on this stock.
Of course, you might find a fantastic investment by looking at a few good candidates. So take a peek at this free list of companies with modest (or no) debt, trading on a P/E below 20.
We aim to bring you long-term focused research analysis driven by fundamental data. Note that our analysis may not factor in the latest price-sensitive company announcements or qualitative material.
If you spot an error that warrants correction, please contact the editor at editorial-team@simplywallst.com. This article by Simply Wall St is general in nature. It does not constitute a recommendation to buy or sell any stock, and does not take account of your objectives, or your financial situation. Simply Wall St has no position in the stocks mentioned. Thank you for reading.
