
 Yahoo Finance
 Do You Know What Severn Trent Plc's (LON:SVT) P/E Ratio Means?

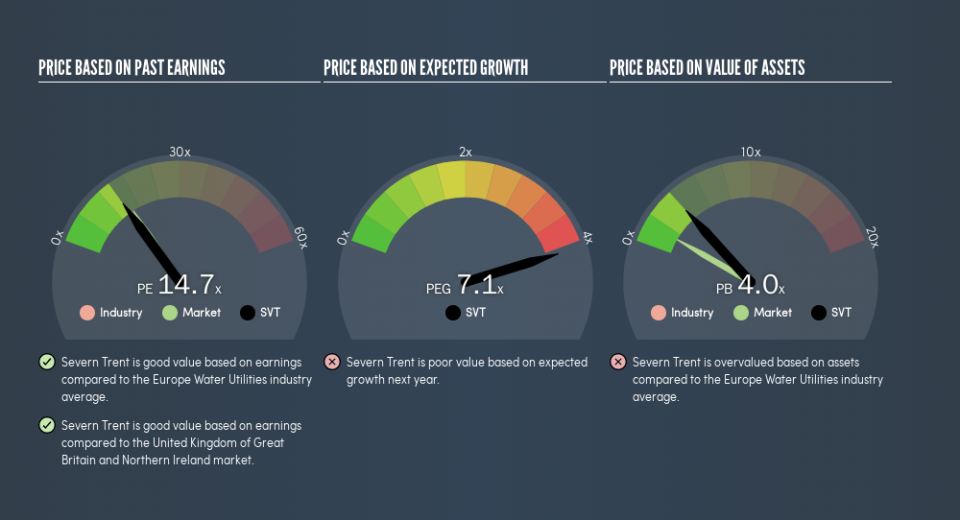
The goal of this article is to teach you how to use price to earnings ratios (P/E ratios). We'll apply a basic P/E ratio analysis to Severn Trent Plc's (LON:SVT), to help you decide if the stock is worth further research. Severn Trent has a P/E ratio of 14.69, based on the last twelve months. That is equivalent to an earnings yield of about 6.8%.
See our latest analysis for Severn Trent
How Do You Calculate A P/E Ratio?
The formula for P/E is:
Price to Earnings Ratio = Price per Share ÷ Earnings per Share (EPS)
Or for Severn Trent:
P/E of 14.69 = £19.61 ÷ £1.33 (Based on the trailing twelve months to March 2019.)
Is A High P/E Ratio Good?
A higher P/E ratio implies that investors pay a higher price for the earning power of the business. That isn't necessarily good or bad, but a high P/E implies relatively high expectations of what a company can achieve in the future.
How Does Severn Trent's P/E Ratio Compare To Its Peers?
The P/E ratio essentially measures market expectations of a company. You can see in the image below that the average P/E (15.4) for companies in the water utilities industry is roughly the same as Severn Trent's P/E.
Its P/E ratio suggests that Severn Trent shareholders think that in the future it will perform about the same as other companies in its industry classification. The company could surprise by performing better than average, in the future. Checking factors such as director buying and selling. could help you form your own view on if that will happen.
How Growth Rates Impact P/E Ratios
When earnings fall, the 'E' decreases, over time. That means even if the current P/E is low, it will increase over time if the share price stays flat. Then, a higher P/E might scare off shareholders, pushing the share price down.
It's nice to see that Severn Trent grew EPS by a stonking 31% in the last year. Unfortunately, earnings per share are down 7.6% a year, over 5 years.
A Limitation: P/E Ratios Ignore Debt and Cash In The Bank
The 'Price' in P/E reflects the market capitalization of the company. Thus, the metric does not reflect cash or debt held by the company. In theory, a company can lower its future P/E ratio by using cash or debt to invest in growth.
While growth expenditure doesn't always pay off, the point is that it is a good option to have; but one that the P/E ratio ignores.
So What Does Severn Trent's Balance Sheet Tell Us?
Severn Trent has net debt worth a very significant 129% of its market capitalization. This level of debt justifies a relatively low P/E, so remain cognizant of the debt, if you're comparing it to other stocks.
The Verdict On Severn Trent's P/E Ratio
Severn Trent trades on a P/E ratio of 14.7, which is below the GB market average of 16. The company has a meaningful amount of debt on the balance sheet, but that should not eclipse the solid earnings growth. The low P/E ratio suggests current market expectations are muted, implying these levels of growth will not continue.
Investors should be looking to buy stocks that the market is wrong about. If the reality for a company is not as bad as the P/E ratio indicates, then the share price should increase as the market realizes this. So this free visualization of the analyst consensus on future earnings could help you make the right decision about whether to buy, sell, or hold.
Of course you might be able to find a better stock than Severn Trent. So you may wish to see this free collection of other companies that have grown earnings strongly.
We aim to bring you long-term focused research analysis driven by fundamental data. Note that our analysis may not factor in the latest price-sensitive company announcements or qualitative material.
If you spot an error that warrants correction, please contact the editor at editorial-team@simplywallst.com. This article by Simply Wall St is general in nature. It does not constitute a recommendation to buy or sell any stock, and does not take account of your objectives, or your financial situation. Simply Wall St has no position in the stocks mentioned. Thank you for reading.
