
 Yahoo Finance
 Are Koninklijke DSM N.V.’s (AMS:DSM) Returns Worth Your While?

Today we’ll evaluate Koninklijke DSM N.V. (AMS:DSM) to determine whether it could have potential as an investment idea. Specifically, we’ll consider its Return On Capital Employed (ROCE), since that will give us an insight into how efficiently the business can generate profits from the capital it requires.
First up, we’ll look at what ROCE is and how we calculate it. Second, we’ll look at its ROCE compared to similar companies. Finally, we’ll look at how its current liabilities affect its ROCE.
Understanding Return On Capital Employed (ROCE)
ROCE is a measure of a company’s yearly pre-tax profit (its return), relative to the capital employed in the business. In general, businesses with a higher ROCE are usually better quality. In brief, it is a useful tool, but it is not without drawbacks. Author Edwin Whiting says to be careful when comparing the ROCE of different businesses, since ‘No two businesses are exactly alike.’
So, How Do We Calculate ROCE?
Analysts use this formula to calculate return on capital employed:
Return on Capital Employed = Earnings Before Interest and Tax (EBIT) ÷ (Total Assets – Current Liabilities)
Or for Koninklijke DSM:
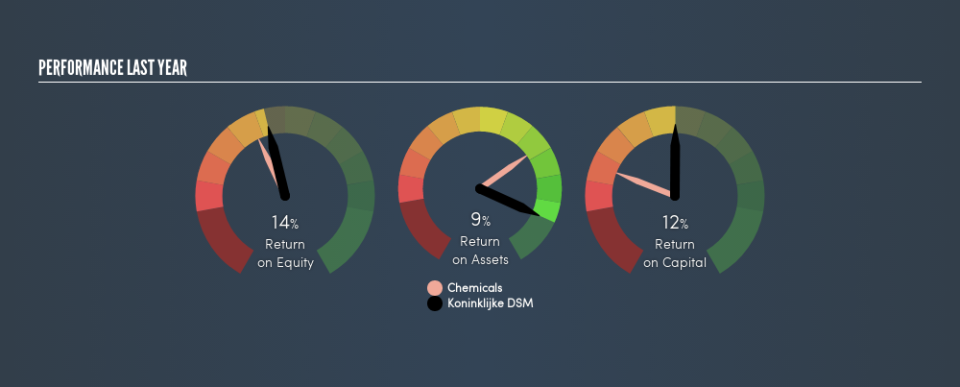
0.12 = €1.3b ÷ (€14b – €2.6b) (Based on the trailing twelve months to December 2018.)
Therefore, Koninklijke DSM has an ROCE of 12%.
See our latest analysis for Koninklijke DSM
Does Koninklijke DSM Have A Good ROCE?
ROCE is commonly used for comparing the performance of similar businesses. We can see Koninklijke DSM’s ROCE is around the 14% average reported by the Chemicals industry. Independently of how Koninklijke DSM compares to its industry, its ROCE in absolute terms appears decent, and the company may be worthy of closer investigation.
Our data shows that Koninklijke DSM currently has an ROCE of 12%, compared to its ROCE of 3.8% 3 years ago. This makes us wonder if the company is improving.
When considering ROCE, bear in mind that it reflects the past and does not necessarily predict the future. Companies in cyclical industries can be difficult to understand using ROCE, as returns typically look high during boom times, and low during busts. ROCE is only a point-in-time measure. What happens in the future is pretty important for investors, so we have prepared a free report on analyst forecasts for Koninklijke DSM.
What Are Current Liabilities, And How Do They Affect Koninklijke DSM’s ROCE?
Short term (or current) liabilities, are things like supplier invoices, overdrafts, or tax bills that need to be paid within 12 months. Due to the way ROCE is calculated, a high level of current liabilities makes a company look as though it has less capital employed, and thus can (sometimes unfairly) boost the ROCE. To check the impact of this, we calculate if a company has high current liabilities relative to its total assets.
Koninklijke DSM has total liabilities of €2.6b and total assets of €14b. Therefore its current liabilities are equivalent to approximately 19% of its total assets. A fairly low level of current liabilities is not influencing the ROCE too much.
Our Take On Koninklijke DSM’s ROCE
Overall, Koninklijke DSM has a decent ROCE and could be worthy of further research. You might be able to find a better buy than Koninklijke DSM. If you want a selection of possible winners, check out this free list of interesting companies that trade on a P/E below 20 (but have proven they can grow earnings).
If you like to buy stocks alongside management, then you might just love this free list of companies. (Hint: insiders have been buying them).
We aim to bring you long-term focused research analysis driven by fundamental data. Note that our analysis may not factor in the latest price-sensitive company announcements or qualitative material.
If you spot an error that warrants correction, please contact the editor at editorial-team@simplywallst.com. This article by Simply Wall St is general in nature. It does not constitute a recommendation to buy or sell any stock, and does not take account of your objectives, or your financial situation. Simply Wall St has no position in the stocks mentioned. Thank you for reading.
