
 Yahoo Finance
 Has Kuehne + Nagel International AG (VTX:KNIN) Got Enough Cash?

With a market capitalization of CHF17b, Kuehne + Nagel International AG (VTX:KNIN) is a large-cap stock, which is considered by most investors as a safe bet. Common characteristics for these big stocks are their strong balance sheet and high liquidity, which means there's plenty of stocks available to the public for trading. These firms won’t be left high and dry if liquidity dries up, and they will be relatively unaffected by rises in interest rates. Today I will analyse the latest financial data for KNIN to determine is solvency and liquidity and whether the stock is a sound investment.
Check out our latest analysis for Kuehne + Nagel International
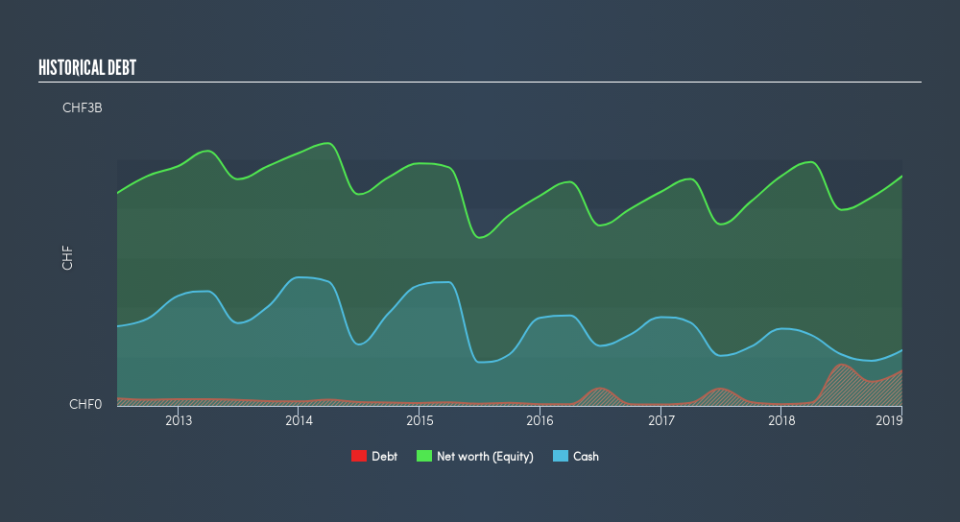
Does KNIN Produce Much Cash Relative To Its Debt?
KNIN's debt levels surged from CHF18m to CHF355m over the last 12 months . With this increase in debt, KNIN currently has CHF562m remaining in cash and short-term investments to keep the business going. On top of this, KNIN has generated CHF679m in operating cash flow over the same time period, resulting in an operating cash to total debt ratio of 191%, meaning that KNIN’s debt is appropriately covered by operating cash.
Can KNIN meet its short-term obligations with the cash in hand?
Looking at KNIN’s CHF4.9b in current liabilities, it seems that the business has maintained a safe level of current assets to meet its obligations, with the current ratio last standing at 1.04x. The current ratio is calculated by dividing current assets by current liabilities. For Shipping companies, this ratio is within a sensible range as there's enough of a cash buffer without holding too much capital in low return investments.
Can KNIN service its debt comfortably?
KNIN’s level of debt is appropriate relative to its total equity, at 15%. This range is considered safe as KNIN is not taking on too much debt obligation, which may be constraining for future growth. We can check to see whether KNIN is able to meet its debt obligations by looking at the net interest coverage ratio. Preferably, earnings before interest and tax (EBIT) should be at least three times as large as net interest. For KNIN, the ratio of 471x suggests that interest is amply covered. High interest coverage serves as an indication of the safety of a company, which highlights why many large organisations like KNIN are considered a risk-averse investment.
Next Steps:
KNIN has demonstrated its ability to generate sufficient levels of cash flow, while its debt hovers at a safe level. Furthermore, the company exhibits an ability to meet its near-term obligations, which isn't a big surprise for a large-cap. I admit this is a fairly basic analysis for KNIN's financial health. Other important fundamentals need to be considered alongside. You should continue to research Kuehne + Nagel International to get a more holistic view of the stock by looking at:
Future Outlook: What are well-informed industry analysts predicting for KNIN’s future growth? Take a look at our free research report of analyst consensus for KNIN’s outlook.
Valuation: What is KNIN worth today? Is the stock undervalued, even when its growth outlook is factored into its intrinsic value? The intrinsic value infographic in our free research report helps visualize whether KNIN is currently mispriced by the market.
Other High-Performing Stocks: Are there other stocks that provide better prospects with proven track records? Explore our free list of these great stocks here.
We aim to bring you long-term focused research analysis driven by fundamental data. Note that our analysis may not factor in the latest price-sensitive company announcements or qualitative material.
If you spot an error that warrants correction, please contact the editor at editorial-team@simplywallst.com. This article by Simply Wall St is general in nature. It does not constitute a recommendation to buy or sell any stock, and does not take account of your objectives, or your financial situation. Simply Wall St has no position in the stocks mentioned. Thank you for reading.
