
 Yahoo Finance
 L.B. Foster (NASDAQ:FSTR) shareholders have earned a 5.8% CAGR over the last five years
It might be of some concern to shareholders to see the L.B. Foster Company (NASDAQ:FSTR) share price down 13% in the last month. But the silver lining is the stock is up over five years. Unfortunately its return of 33% is below the market return of 123%. While the returns over the last 5 years have been good, we do feel sorry for those shareholders who haven't held shares that long, because the share price is down 31% in the last three years.
So let's assess the underlying fundamentals over the last 5 years and see if they've moved in lock-step with shareholder returns.
See our latest analysis for L.B. Foster
To quote Buffett, 'Ships will sail around the world but the Flat Earth Society will flourish. There will continue to be wide discrepancies between price and value in the marketplace...' One flawed but reasonable way to assess how sentiment around a company has changed is to compare the earnings per share (EPS) with the share price.
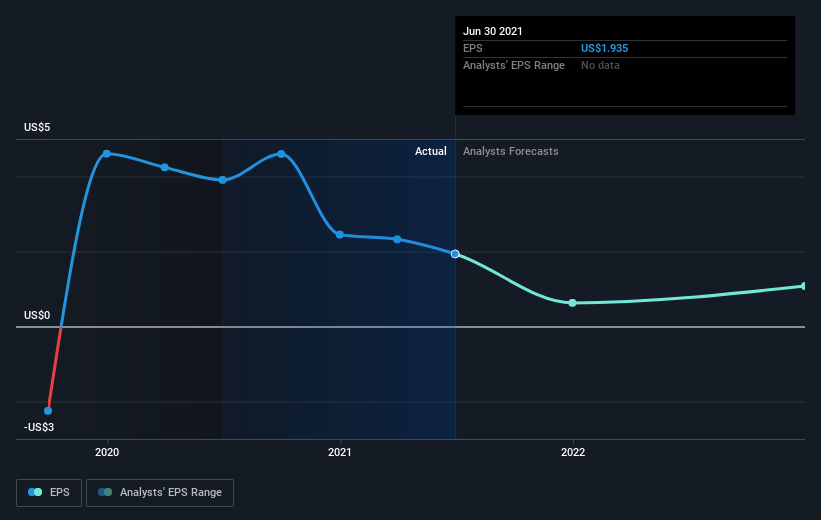
During the five years of share price growth, L.B. Foster moved from a loss to profitability. That would generally be considered a positive, so we'd expect the share price to be up. Given that the company made a profit three years ago, but not five years ago, it is worth looking at the share price returns over the last three years, too. In fact, the L.B. Foster stock price is 31% lower in the last three years. Meanwhile, EPS is up 34% per year. So there seems to be a mismatch between the positive EPS growth and the change in the share price, which is down -12% per year.
The company's earnings per share (over time) is depicted in the image below (click to see the exact numbers).
We know that L.B. Foster has improved its bottom line over the last three years, but what does the future have in store? It might be well worthwhile taking a look at our free report on how its financial position has changed over time.
A Different Perspective
L.B. Foster shareholders are up 6.0% for the year. But that was short of the market average. On the bright side, that's still a gain, and it's actually better than the average return of 6% over half a decade This suggests the company might be improving over time. I find it very interesting to look at share price over the long term as a proxy for business performance. But to truly gain insight, we need to consider other information, too. Consider for instance, the ever-present spectre of investment risk. We've identified 2 warning signs with L.B. Foster (at least 1 which is a bit concerning) , and understanding them should be part of your investment process.
If you are like me, then you will not want to miss this free list of growing companies that insiders are buying.
Please note, the market returns quoted in this article reflect the market weighted average returns of stocks that currently trade on US exchanges.
This article by Simply Wall St is general in nature. We provide commentary based on historical data and analyst forecasts only using an unbiased methodology and our articles are not intended to be financial advice. It does not constitute a recommendation to buy or sell any stock, and does not take account of your objectives, or your financial situation. We aim to bring you long-term focused analysis driven by fundamental data. Note that our analysis may not factor in the latest price-sensitive company announcements or qualitative material. Simply Wall St has no position in any stocks mentioned.
Have feedback on this article? Concerned about the content? Get in touch with us directly. Alternatively, email editorial-team (at) simplywallst.com.
