
 Yahoo Finance
 Is L&T Technology Services Limited (NSE:LTTS) As Strong As Its Balance Sheet Indicates?

Want to participate in a short research study? Help shape the future of investing tools and you could win a $250 gift card!
Mid-caps stocks, like L&T Technology Services Limited (NSE:LTTS) with a market capitalization of ₹178b, aren’t the focus of most investors who prefer to direct their investments towards either large-cap or small-cap stocks. However, generally ignored mid-caps have historically delivered better risk-adjusted returns than the two other categories of stocks. Today we will look at LTTS’s financial liquidity and debt levels, which are strong indicators for whether the company can weather economic downturns or fund strategic acquisitions for future growth. Remember this is a very top-level look that focuses exclusively on financial health, so I recommend a deeper analysis into LTTS here.
See our latest analysis for L&T Technology Services
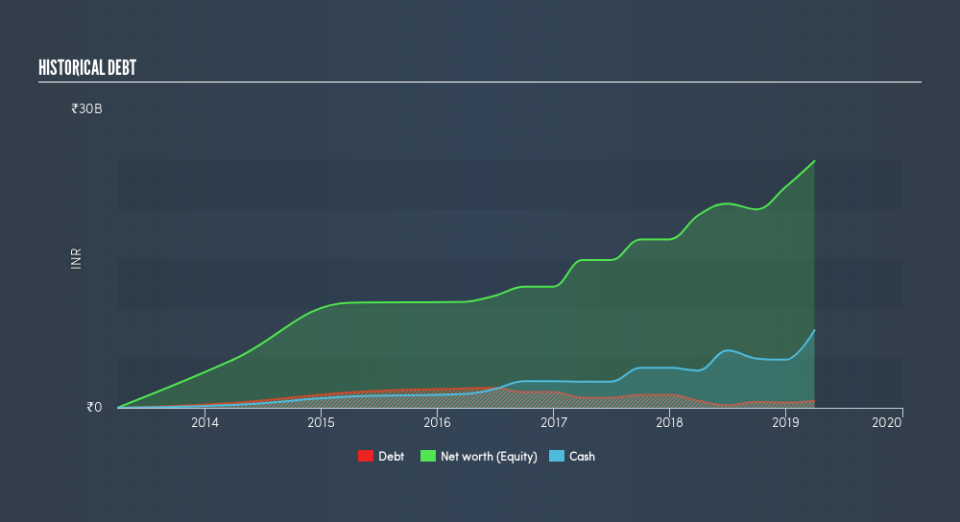
Does LTTS Produce Much Cash Relative To Its Debt?
Over the past year, LTTS has maintained its debt levels at around ₹702m made up of predominantly near term debt. At this stable level of debt, the current cash and short-term investment levels stands at ₹7.8b to keep the business going. Additionally, LTTS has generated ₹8.1b in operating cash flow in the last twelve months, leading to an operating cash to total debt ratio of 1148%, signalling that LTTS’s operating cash is sufficient to cover its debt.
Can LTTS meet its short-term obligations with the cash in hand?
At the current liabilities level of ₹8.6b, it appears that the company has maintained a safe level of current assets to meet its obligations, with the current ratio last standing at 2.75x. The current ratio is the number you get when you divide current assets by current liabilities. Usually, for Professional Services companies, this is a suitable ratio as there's enough of a cash buffer without holding too much capital in low return investments.
Is LTTS’s debt level acceptable?
With a debt-to-equity ratio of 2.8%, LTTS's debt level is relatively low. LTTS is not taking on too much debt commitment, which may be constraining for future growth.
Next Steps:
LTTS’s high cash coverage and low debt levels indicate its ability to utilise its borrowings efficiently in order to generate ample cash flow. Furthermore, the company exhibits an ability to meet its near term obligations should an adverse event occur. Keep in mind I haven't considered other factors such as how LTTS has been performing in the past. I recommend you continue to research L&T Technology Services to get a more holistic view of the stock by looking at:
Future Outlook: What are well-informed industry analysts predicting for LTTS’s future growth? Take a look at our free research report of analyst consensus for LTTS’s outlook.
Valuation: What is LTTS worth today? Is the stock undervalued, even when its growth outlook is factored into its intrinsic value? The intrinsic value infographic in our free research report helps visualize whether LTTS is currently mispriced by the market.
Other High-Performing Stocks: Are there other stocks that provide better prospects with proven track records? Explore our free list of these great stocks here.
We aim to bring you long-term focused research analysis driven by fundamental data. Note that our analysis may not factor in the latest price-sensitive company announcements or qualitative material.
If you spot an error that warrants correction, please contact the editor at editorial-team@simplywallst.com. This article by Simply Wall St is general in nature. It does not constitute a recommendation to buy or sell any stock, and does not take account of your objectives, or your financial situation. Simply Wall St has no position in the stocks mentioned. Thank you for reading.
