
 Yahoo Finance
 What Is Lam Research's (NASDAQ:LRCX) P/E Ratio After Its Share Price Tanked?

To the annoyance of some shareholders, Lam Research (NASDAQ:LRCX) shares are down a considerable 37% in the last month. The stock has been solid, longer term, gaining 19% in the last year.
All else being equal, a share price drop should make a stock more attractive to potential investors. While the market sentiment towards a stock is very changeable, in the long run, the share price will tend to move in the same direction as earnings per share. So, on certain occasions, long term focussed investors try to take advantage of pessimistic expectations to buy shares at a better price. One way to gauge market expectations of a stock is to look at its Price to Earnings Ratio (PE Ratio). A high P/E implies that investors have high expectations of what a company can achieve compared to a company with a low P/E ratio.
See our latest analysis for Lam Research
Does Lam Research Have A Relatively High Or Low P/E For Its Industry?
Lam Research's P/E of 15.17 indicates relatively low sentiment towards the stock. The image below shows that Lam Research has a lower P/E than the average (22.9) P/E for companies in the semiconductor industry.
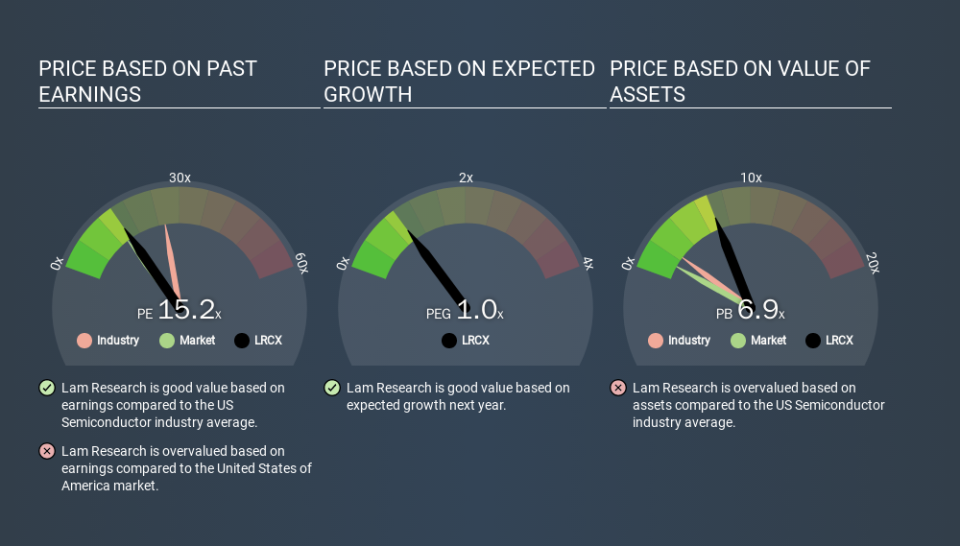
This suggests that market participants think Lam Research will underperform other companies in its industry. While current expectations are low, the stock could be undervalued if the situation is better than the market assumes. It is arguably worth checking if insiders are buying shares, because that might imply they believe the stock is undervalued.
How Growth Rates Impact P/E Ratios
Earnings growth rates have a big influence on P/E ratios. If earnings are growing quickly, then the 'E' in the equation will increase faster than it would otherwise. And in that case, the P/E ratio itself will drop rather quickly. So while a stock may look expensive based on past earnings, it could be cheap based on future earnings.
Lam Research shrunk earnings per share by 23% over the last year. But EPS is up 26% over the last 5 years.
A Limitation: P/E Ratios Ignore Debt and Cash In The Bank
One drawback of using a P/E ratio is that it considers market capitalization, but not the balance sheet. That means it doesn't take debt or cash into account. Theoretically, a business can improve its earnings (and produce a lower P/E in the future) by investing in growth. That means taking on debt (or spending its cash).
Such spending might be good or bad, overall, but the key point here is that you need to look at debt to understand the P/E ratio in context.
So What Does Lam Research's Balance Sheet Tell Us?
Since Lam Research holds net cash of US$278m, it can spend on growth, justifying a higher P/E ratio than otherwise.
The Verdict On Lam Research's P/E Ratio
Lam Research has a P/E of 15.2. That's higher than the average in its market, which is 12.7. The recent drop in earnings per share would make some investors cautious, but the healthy balance sheet means the company retains the potential for future growth. If this growth fails to materialise, the current high P/E could prove to be temporary, as the share price falls. Given Lam Research's P/E ratio has declined from 24.1 to 15.2 in the last month, we know for sure that the market is significantly less confident about the business today, than it was back then. For those who prefer to invest with the flow of momentum, that might be a bad sign, but for a contrarian, it may signal opportunity.
Investors have an opportunity when market expectations about a stock are wrong. If the reality for a company is better than it expects, you can make money by buying and holding for the long term. So this free visualization of the analyst consensus on future earnings could help you make the right decision about whether to buy, sell, or hold.
Of course, you might find a fantastic investment by looking at a few good candidates. So take a peek at this free list of companies with modest (or no) debt, trading on a P/E below 20.
If you spot an error that warrants correction, please contact the editor at editorial-team@simplywallst.com. This article by Simply Wall St is general in nature. It does not constitute a recommendation to buy or sell any stock, and does not take account of your objectives, or your financial situation. Simply Wall St has no position in the stocks mentioned.
We aim to bring you long-term focused research analysis driven by fundamental data. Note that our analysis may not factor in the latest price-sensitive company announcements or qualitative material. Thank you for reading.
