
 Yahoo Finance
 Las Vegas Sands (LVS) Q3 Earnings & Revenues Lag Estimates
Las Vegas Sands Corp. LVS reported third-quarter 2019 results, wherein both earnings and revenues missed the respective Zacks Consensus Estimate for the second straight quarter. Moreover, both the metrics also declined year over year.
Adjusted earnings came in at 75 cents per share, which missed the Zacks Consensus Estimate by a penny and declined 2.6% year over year. The bottom line was impacted by higher interest expenses. In the reported quarter, interest expense, net of amounts capitalized, improved to $137 million compared with $126 million in the year-ago quarter.
Net revenues totaled $3,250 million, which lagged the consensus mark of $3,314 million and declined 2.6% on a year-over-year basis. The top line was negatively impacted by decline in casino, and convention, retail and other revenues.
Las Vegas Sands Corp. Price, Consensus and EPS Surprise
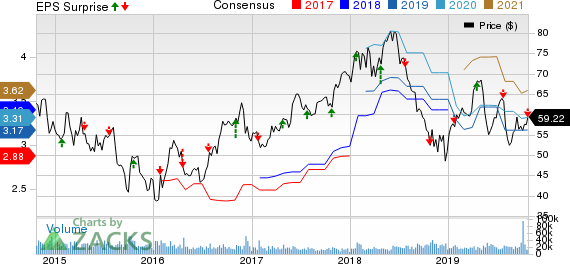
Las Vegas Sands Corp. price-consensus-eps-surprise-chart | Las Vegas Sands Corp. Quote
Asian Operations
Las Vegas Sands’ Asia business includes the following resorts:
The Venetian Macao
Net revenues declined 0.7% year over year to $851 million. Casino and rooms revenues came in at $689 and $58 million, respectively, flat year over year. However, food and beverage, and convention, retail and other revenues declined 19% and 24.1% year over year to $17 million and $22 million, respectively. Mall revenues improved 8.3% year over year to $65 million.
Adjusted property EBITDA were down 0.6% year over year to $342 million in the quarter under review.
While non-rolling chip drop improved 7.6%, rolling chip volume declined 20.6%.
Sands Cotai Central
Net revenues decreased 9.3% year over year to $487 million owing to a 10.3% decline in casino revenues, 4.7% fall in rooms revenues and 4% decrease in food and beverage. Moreover, mall revenues remained flat year over year, while convention, retail and other revenues declined 50%.
Adjusted property EBITDA was $169 million, down 10.1% year over year.
Both non-rolling chip drop and rolling chip volume declined 2.5% and 56.8%, respectively.
The Parisian Macao
Revenues amounted to $381 million, reflecting year-over-year decrease of 2.1%. The downside can primarily be attributed to a decline of 2.8% in casino revenues. However, rooms and food and beverage revenues were up 10% and 5.9%, respectively.
Adjusted property EBITDA decreased 1.6% year over year to $120 million.
Non-rolling chip drop improved 7.3%, while rolling chip volume declined 24.8%.
The Plaza Macao and Four Seasons Hotel Macao
Net revenues jumped 17.4% to $196 million on a 25.9% and 16.7% improvement in casino, and food and beverage revenues, respectively. However, revenues from mall declined 6.1% year over year. Casino revenues were flat in the reported quarter.
Adjusted property EBITDA jumped 41.5% to $75 million.
Rolling chip volume decreased 35.2% while non-rolling chip drop advanced 23.4%.
Sands Macao
Revenues were up 6.9% year over year to $171 million on account of an 8.9% increase in casino revenues.
Adjusted property EBITDA rose 26.8% to $52 million.
While rolling chip volume declined 39.2%, non-rolling chip drop improved 6.6%.
Marina Bay Sands, Singapore
Net revenues rose 3.5% year over year to $793 million due to an impropvement of 3.9% in casino revenues. Meanwhile, convention, retail and other revenues declined 22.6%. Mall revenues were up 4.5% year over year.
Adjusted property EBITDA of $435 million in the third quarter increased 3.8%.
While non-rolling chip drop rose 4.6%, rolling chip volume improved 2.4%.
Domestic Operations
Las Vegas
Net revenues from Las Vegas operations, which comprise The Venetian Las Vegas and The Palazzo including the Sands Expo and Convention Center, increased 7.1% to $406 million on an 17% and 10% rise in casino, and food and beverage revenues, respectively. Rooms revenues also increased 4.3%. However, convention, retail and other revenues remained flat year over year.
Adjusted property EBITDA in the reported quarter totaled $93 million, surging 22.4% on a year-over-year basis.
Table games drop were down 6.7%, while slot handle advanced 6.8%.
Operating Results
On a consolidated basis, adjusted property EBITDA came in at $1.28 billion in the third quarter, flat year over year. Las Vegas operating properties, Sands Macao and The Plaza Macao and Four Seasons Hotel Macao adjusted EBITDA improved in the quarter, while The Venetian Macao and The Parisian Macao witnessed decline in adjusted EBITDA.
Balance Sheet
As of Sep 30, 2019, unrestricted cash balances amounted to $3.82 billion. Total debt outstanding (excluding finance leases) amounted to $11.93 billion.
In the reported quarter, capital expenditures totaled $303 million. This was primarily due to construction, development and maintenance activities of $183 million in Macao, $36 million at Marina Bay Sands and $84 million in Las Vegas.
Quarterly dividend paid by the company was 77 cents per share, while it repurchased $100 million of its common stock.
Las Vegas Sands, which shares space with MGM Resorts International MGM and Caesars Entertainment Corporation CZR, has a Zacks Rank #3 (Hold). You can see the complete list of today’s Zacks #1 Rank (Strong Buy) stocks here.
A Key Pick
A top-ranked stock in the same space include International Game Technology PLC IGT, carrying a Zacks Rank #2 (Buy).
International Game Technology’s long-term earnings are expected to improve by 10%.
Today's Best Stocks from Zacks
Would you like to see the updated picks from our best market-beating strategies? From 2017 through 2018, while the S&P 500 gained +15.8%, five of our screens returned +38.0%, +61.3%, +61.6%, +68.1%, and +98.3%.
This outperformance has not just been a recent phenomenon. From 2000 – 2018, while the S&P averaged +4.8% per year, our top strategies averaged up to +56.2% per year.
See their latest picks free >>
Want the latest recommendations from Zacks Investment Research? Today, you can download 7 Best Stocks for the Next 30 Days. Click to get this free report
MGM Resorts International (MGM) : Free Stock Analysis Report
Las Vegas Sands Corp. (LVS) : Free Stock Analysis Report
International Game Technology (IGT) : Free Stock Analysis Report
Caesars Entertainment Corporation (CZR) : Free Stock Analysis Report
To read this article on Zacks.com click here.
Zacks Investment Research
