
 Yahoo Finance
 Leaf Group Ltd. (NYSE:LEAF): Should The Recent Earnings Drop Worry You?

Understanding how Leaf Group Ltd. (NYSE:LEAF) is performing as a company requires looking at more than just a years' earnings. Today I will run you through a basic sense check to gain perspective on how Leaf Group is doing by comparing its latest earnings with its long-term trend as well as the performance of its online retail industry peers.
See our latest analysis for Leaf Group
Was LEAF weak performance lately part of a long-term decline?
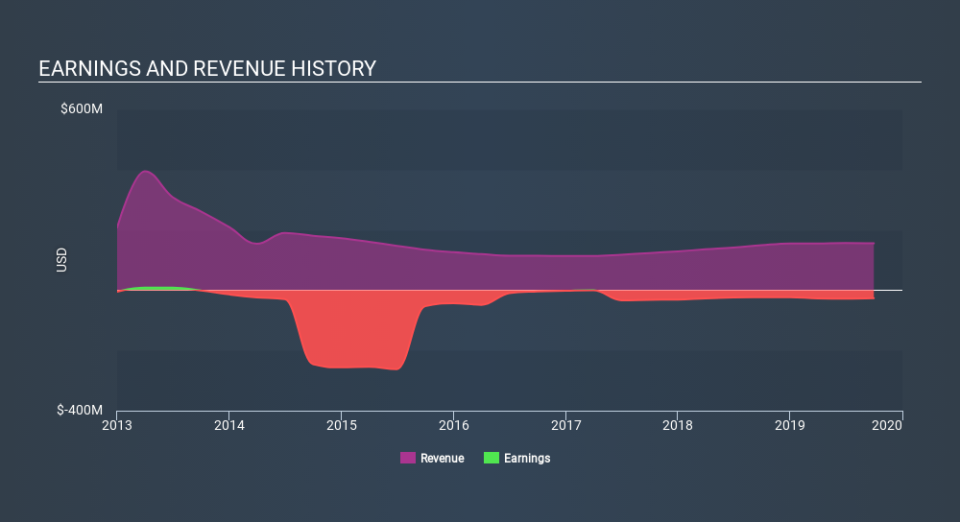
LEAF is loss-making, with the most recent trailing twelve-month earnings of -US$26.5m (from 30 September 2019), which compared to last year has become more negative. However, the company's loss seem to be contracting over the medium term, with the five-year earnings average of -US$54.1m. Each year, for the past five years LEAF has seen an annual decline in revenue of -0.3%, on average. This adverse movement is a driver of the company's inability to reach breakeven.
Looking at growth from a sector-level, the US online retail industry has been growing, albeit, at a subdued single-digit rate of 8.2% in the previous twelve months, and a substantial 21% over the past half a decade. This growth is a median of profitable companies of 22 Online Retail companies in US including Grubhub, Trxade Group and Shutterfly. This means any tailwind the industry is deriving benefit from, Leaf Group has not been able to realize the gains unlike its industry peers.
Given that Leaf Group is not profitable, even if operating expenses (SG&A and one-year R&D) continues to fall at previous year’s rate of -3.3%, the company’s current cash level (US$12m) will still be insufficient to cover its expenses in the upcoming year. This is not a great sign in terms of operations and cash management. Even though this is analysis is fairly basic, and Leaf Group still can cut its overhead further, or open a new line of credit instead of issuing new equity shares, the outcome of this analysis still gives us an idea of the company’s timeline and when things will have to start changing, since its current operation is unsustainable.
What does this mean?
Leaf Group's track record can be a valuable insight into its earnings performance, but it certainly doesn't tell the whole story. With companies that are currently loss-making, it is always difficult to predict what will happen in the future and when. The most valuable step is to assess company-specific issues Leaf Group may be facing and whether management guidance has steadily been met in the past. I suggest you continue to research Leaf Group to get a better picture of the stock by looking at:
Future Outlook: What are well-informed industry analysts predicting for LEAF’s future growth? Take a look at our free research report of analyst consensus for LEAF’s outlook.
Financial Health: Are LEAF’s operations financially sustainable? Balance sheets can be hard to analyze, which is why we’ve done it for you. Check out our financial health checks here.
Other High-Performing Stocks: Are there other stocks that provide better prospects with proven track records? Explore our free list of these great stocks here.
NB: Figures in this article are calculated using data from the trailing twelve months from 30 September 2019. This may not be consistent with full year annual report figures.
If you spot an error that warrants correction, please contact the editor at editorial-team@simplywallst.com. This article by Simply Wall St is general in nature. It does not constitute a recommendation to buy or sell any stock, and does not take account of your objectives, or your financial situation. Simply Wall St has no position in the stocks mentioned.
We aim to bring you long-term focused research analysis driven by fundamental data. Note that our analysis may not factor in the latest price-sensitive company announcements or qualitative material. Thank you for reading.
