
 Yahoo Finance
 What Can We Learn From Barco NV’s (EBR:BAR) Investment Returns?
Today we'll look at Barco NV (EBR:BAR) and reflect on its potential as an investment. To be precise, we'll consider its Return On Capital Employed (ROCE), as that will inform our view of the quality of the business.
First up, we'll look at what ROCE is and how we calculate it. Next, we'll compare it to others in its industry. Finally, we'll look at how its current liabilities affect its ROCE.
Return On Capital Employed (ROCE): What is it?
ROCE is a measure of a company's yearly pre-tax profit (its return), relative to the capital employed in the business. All else being equal, a better business will have a higher ROCE. Ultimately, it is a useful but imperfect metric. Renowned investment researcher Michael Mauboussin has suggested that a high ROCE can indicate that 'one dollar invested in the company generates value of more than one dollar'.
How Do You Calculate Return On Capital Employed?
Analysts use this formula to calculate return on capital employed:
Return on Capital Employed = Earnings Before Interest and Tax (EBIT) ÷ (Total Assets - Current Liabilities)
Or for Barco:
0.12 = €99m ÷ (€1.1b - €290m) (Based on the trailing twelve months to June 2019.)
So, Barco has an ROCE of 12%.
Check out our latest analysis for Barco
Does Barco Have A Good ROCE?
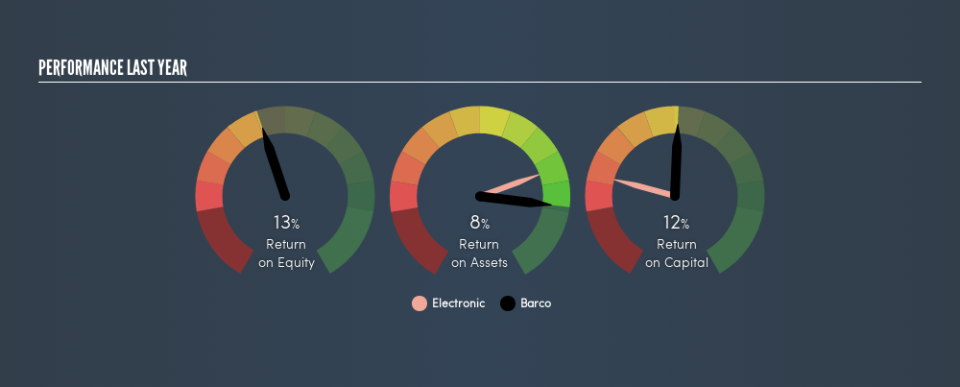
One way to assess ROCE is to compare similar companies. We can see Barco's ROCE is around the 13% average reported by the Electronic industry. Independently of how Barco compares to its industry, its ROCE in absolute terms appears decent, and the company may be worthy of closer investigation.
In our analysis, Barco's ROCE appears to be 12%, compared to 3 years ago, when its ROCE was 3.0%. This makes us wonder if the company is improving. You can click on the image below to see (in greater detail) how Barco's past growth compares to other companies.
When considering this metric, keep in mind that it is backwards looking, and not necessarily predictive. Companies in cyclical industries can be difficult to understand using ROCE, as returns typically look high during boom times, and low during busts. ROCE is only a point-in-time measure. What happens in the future is pretty important for investors, so we have prepared a free report on analyst forecasts for Barco.
Do Barco's Current Liabilities Skew Its ROCE?
Current liabilities include invoices, such as supplier payments, short-term debt, or a tax bill, that need to be paid within 12 months. The ROCE equation subtracts current liabilities from capital employed, so a company with a lot of current liabilities appears to have less capital employed, and a higher ROCE than otherwise. To counteract this, we check if a company has high current liabilities, relative to its total assets.
Barco has total liabilities of €290m and total assets of €1.1b. As a result, its current liabilities are equal to approximately 26% of its total assets. Current liabilities are minimal, limiting the impact on ROCE.
What We Can Learn From Barco's ROCE
Overall, Barco has a decent ROCE and could be worthy of further research. Barco shapes up well under this analysis, but it is far from the only business delivering excellent numbers . You might also want to check this free collection of companies delivering excellent earnings growth.
If you like to buy stocks alongside management, then you might just love this free list of companies. (Hint: insiders have been buying them).
We aim to bring you long-term focused research analysis driven by fundamental data. Note that our analysis may not factor in the latest price-sensitive company announcements or qualitative material.
If you spot an error that warrants correction, please contact the editor at editorial-team@simplywallst.com. This article by Simply Wall St is general in nature. It does not constitute a recommendation to buy or sell any stock, and does not take account of your objectives, or your financial situation. Simply Wall St has no position in the stocks mentioned. Thank you for reading.
