
 Yahoo Finance
 What Can We Learn From Fresenius SE & Co. KGaA’s (ETR:FRE) Investment Returns?

Today we'll evaluate Fresenius SE & Co. KGaA (ETR:FRE) to determine whether it could have potential as an investment idea. In particular, we'll consider its Return On Capital Employed (ROCE), as that can give us insight into how profitably the company is able to employ capital in its business.
First up, we'll look at what ROCE is and how we calculate it. Second, we'll look at its ROCE compared to similar companies. Finally, we'll look at how its current liabilities affect its ROCE.
What is Return On Capital Employed (ROCE)?
ROCE measures the amount of pre-tax profits a company can generate from the capital employed in its business. All else being equal, a better business will have a higher ROCE. Ultimately, it is a useful but imperfect metric. Author Edwin Whiting says to be careful when comparing the ROCE of different businesses, since 'No two businesses are exactly alike.
How Do You Calculate Return On Capital Employed?
Analysts use this formula to calculate return on capital employed:
Return on Capital Employed = Earnings Before Interest and Tax (EBIT) ÷ (Total Assets - Current Liabilities)
Or for Fresenius SE KGaA:
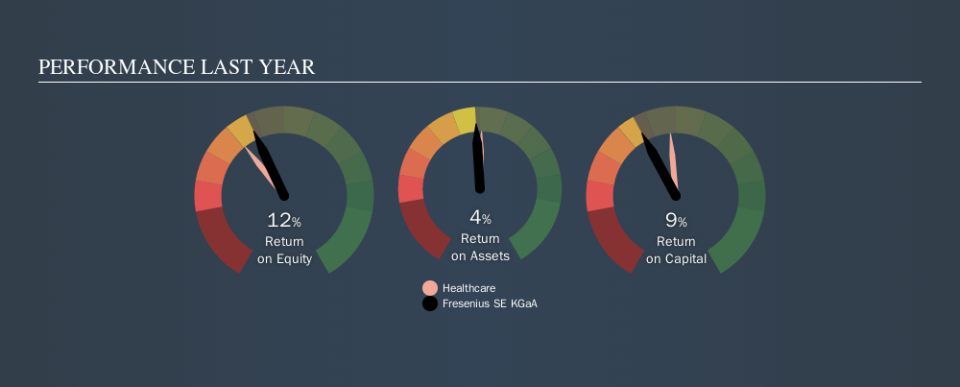
0.086 = €4.4b ÷ (€65b - €14b) (Based on the trailing twelve months to June 2019.)
So, Fresenius SE KGaA has an ROCE of 8.6%.
View our latest analysis for Fresenius SE KGaA
Is Fresenius SE KGaA's ROCE Good?
ROCE is commonly used for comparing the performance of similar businesses. We can see Fresenius SE KGaA's ROCE is around the 7.6% average reported by the Healthcare industry. Regardless of where Fresenius SE KGaA sits next to its industry, its ROCE in absolute terms appears satisfactory, and this company could be worth a closer look.
You can click on the image below to see (in greater detail) how Fresenius SE KGaA's past growth compares to other companies.
It is important to remember that ROCE shows past performance, and is not necessarily predictive. ROCE can be deceptive for cyclical businesses, as returns can look incredible in boom times, and terribly low in downturns. ROCE is only a point-in-time measure. Since the future is so important for investors, you should check out our free report on analyst forecasts for Fresenius SE KGaA.
Fresenius SE KGaA's Current Liabilities And Their Impact On Its ROCE
Liabilities, such as supplier bills and bank overdrafts, are referred to as current liabilities if they need to be paid within 12 months. The ROCE equation subtracts current liabilities from capital employed, so a company with a lot of current liabilities appears to have less capital employed, and a higher ROCE than otherwise. To counter this, investors can check if a company has high current liabilities relative to total assets.
Fresenius SE KGaA has total liabilities of €14b and total assets of €65b. As a result, its current liabilities are equal to approximately 21% of its total assets. Low current liabilities are not boosting the ROCE too much.
Our Take On Fresenius SE KGaA's ROCE
With that in mind, Fresenius SE KGaA's ROCE appears pretty good. There might be better investments than Fresenius SE KGaA out there, but you will have to work hard to find them . These promising businesses with rapidly growing earnings might be right up your alley.
If you are like me, then you will not want to miss this free list of growing companies that insiders are buying.
We aim to bring you long-term focused research analysis driven by fundamental data. Note that our analysis may not factor in the latest price-sensitive company announcements or qualitative material.
If you spot an error that warrants correction, please contact the editor at editorial-team@simplywallst.com. This article by Simply Wall St is general in nature. It does not constitute a recommendation to buy or sell any stock, and does not take account of your objectives, or your financial situation. Simply Wall St has no position in the stocks mentioned. Thank you for reading.
