
 Yahoo Finance
 Legal & General Group Plc (LON:LGEN) Delivered A Better ROE Than Its Industry
Many investors are still learning about the various metrics that can be useful when analysing a stock. This article is for those who would like to learn about Return On Equity (ROE). We'll use ROE to examine Legal & General Group Plc (LON:LGEN), by way of a worked example.
Return on equity or ROE is an important factor to be considered by a shareholder because it tells them how effectively their capital is being reinvested. In other words, it is a profitability ratio which measures the rate of return on the capital provided by the company's shareholders.
See our latest analysis for Legal & General Group
How Is ROE Calculated?
The formula for return on equity is:
Return on Equity = Net Profit (from continuing operations) ÷ Shareholders' Equity
So, based on the above formula, the ROE for Legal & General Group is:
19% = UK£2.0b ÷ UK£11b (Based on the trailing twelve months to December 2021).
The 'return' is the yearly profit. Another way to think of that is that for every £1 worth of equity, the company was able to earn £0.19 in profit.
Does Legal & General Group Have A Good Return On Equity?
By comparing a company's ROE with its industry average, we can get a quick measure of how good it is. Importantly, this is far from a perfect measure, because companies differ significantly within the same industry classification. Pleasingly, Legal & General Group has a superior ROE than the average (12%) in the Insurance industry.
That is a good sign. With that said, a high ROE doesn't always indicate high profitability. Especially when a firm uses high levels of debt to finance its debt which may boost its ROE but the high leverage puts the company at risk. You can see the 2 risks we have identified for Legal & General Group by visiting our risks dashboard for free on our platform here.
Why You Should Consider Debt When Looking At ROE
Virtually all companies need money to invest in the business, to grow profits. That cash can come from retained earnings, issuing new shares (equity), or debt. In the first and second cases, the ROE will reflect this use of cash for investment in the business. In the latter case, the use of debt will improve the returns, but will not change the equity. That will make the ROE look better than if no debt was used.
Legal & General Group's Debt And Its 19% ROE
We think Legal & General Group uses a significant amount of debt to maximize its returns, as it has a significantly higher debt to equity ratio of 5.70. Its ROE is pretty good, but given the impact of the debt, we're less than enthused, overall.
Summary
Return on equity is useful for comparing the quality of different businesses. Companies that can achieve high returns on equity without too much debt are generally of good quality. If two companies have the same ROE, then I would generally prefer the one with less debt.
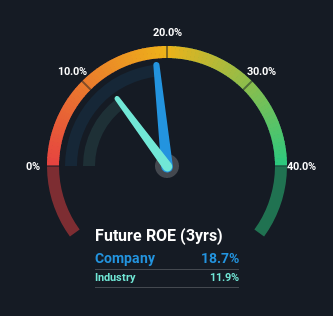
Having said that, while ROE is a useful indicator of business quality, you'll have to look at a whole range of factors to determine the right price to buy a stock. Profit growth rates, versus the expectations reflected in the price of the stock, are a particularly important to consider. So you might want to take a peek at this data-rich interactive graph of forecasts for the company.
Of course, you might find a fantastic investment by looking elsewhere. So take a peek at this free list of interesting companies.
Have feedback on this article? Concerned about the content? Get in touch with us directly. Alternatively, email editorial-team (at) simplywallst.com.
This article by Simply Wall St is general in nature. We provide commentary based on historical data and analyst forecasts only using an unbiased methodology and our articles are not intended to be financial advice. It does not constitute a recommendation to buy or sell any stock, and does not take account of your objectives, or your financial situation. We aim to bring you long-term focused analysis driven by fundamental data. Note that our analysis may not factor in the latest price-sensitive company announcements or qualitative material. Simply Wall St has no position in any stocks mentioned.
