
 Yahoo Finance
 Liberty Interactive (QVCA) Q4 Earnings & Sales Top Estimates

Liberty Interactive Corp. QVCA delivered impressive fourth-quarter 2017 results, with the bottom and top line surpassing the Zacks Consensus Estimate. The company’s earnings (on an adjusted basis) of $2.05 per share surpassed the Zacks Consensus Estimate of 48 cents. Results were backed by higher revenues.
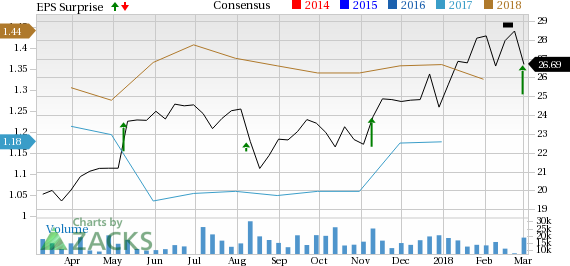
Liberty Interactive Corporation Price, Consensus and EPS Surprise
Liberty Interactive Corporation Price, Consensus and EPS Surprise | Liberty Interactive Corporation Quote
Total revenues were $3,337 million, up 7% year over year. The figure also surpassed the Zacks Consensus Estimate of $3,244 million.
Operating Metrics
Total operating income was $391 million compared with $384 million in the year-ago quarter. In the fourth quarter, consolidated adjusted operating income before depreciation and amortization (OIBDA) was $604 million compared with $610 million in the year-ago quarter.
Cash Flow & Liquidity
In 2017, Liberty Interactive generated $1,492 million in cash from operations compared with $1,443 million in 2016.
As of Dec 31, 2017, the company had total cash and cash equivalents of $903 million compared with $825 million at the end of December 2016. The company exited the period with $7,553 million of outstanding debt compared with $7,166 million at the end of 2016.
QVC Segment
Revenues in the QVC division were $2,817 million, up 6% from the year-ago quarter. Revenues from the QVC US segment totaled $2,029 million, up 4% year over year. Revenues from the QVC International segment were $788 million, up 11% year over year. QVC US adjusted OIBDA of $436 million was flat year over year, while the same for QVC International was $147 million, up 12% on a year-over-year basis.
zulily Segment
Quarterly revenues in the zulily segment totaled $520 million, up 11% on a year-over-year basis. Quarterly adjusted OIBDA was $38 million, down 5%. Quarterly adjusted OIBDA margin declined to 7.3% from 8.6% in the year-ago quarter. Meanwhile, operating loss was $18 million compared with operating loss of $14 million in the prior-year quarter.
HSN Segment
Quarterly revenues in the HSN standalone segment totaled $712 million, down 8% year over year. Quarterly adjusted OIBDA was $79 million, up 5%. Quarterly adjusted OIBDA margin increased to 11.1% from 9.8% in the year-ago quarter. Meanwhile, operating loss was $3 million in the reported quarter against operating income of $64 million in the prior-year quarter.
We remind investors that Liberty Interactive completed the acquisition of the remaining 61.8% of the home-shopping platform — HSN Inc. — on Dec 29, 2017. The merged entity has become the third-largest online site, competing against Amazon.com AMZN, Cars.com CARS and Wal-Mart Stores WMT in the global e-commerce business.
Zacks Rank
Liberty Interactive carries a Zacks Rank #3 (Hold). You can see the complete list of today’s Zacks #1 (Strong Buy) Rank stocks here.
The Hottest Tech Mega-Trend of All
Last year, it generated $8 billion in global revenues. By 2020, it's predicted to blast through the roof to $47 billion. Famed investor Mark Cuban says it will produce "the world's first trillionaires," but that should still leave plenty of money for regular investors who make the right trades early.
See Zacks' 3 Best Stocks to Play This Trend >>
Want the latest recommendations from Zacks Investment Research? Today, you can download 7 Best Stocks for the Next 30 Days. Click to get this free report
Amazon.com, Inc. (AMZN) : Free Stock Analysis Report
Liberty Interactive Corporation (QVCA) : Free Stock Analysis Report
Wal-Mart Stores, Inc. (WMT) : Free Stock Analysis Report
Cars.com Inc. (CARS) : Free Stock Analysis Report
To read this article on Zacks.com click here.
Zacks Investment Research
