
 Yahoo Finance
 Such Is Life: How Tullow Oil (LON:TLW) Shareholders Saw Their Shares Drop 59%

We think intelligent long term investing is the way to go. But unfortunately, some companies simply don't succeed. Zooming in on an example, the Tullow Oil plc (LON:TLW) share price dropped 59% in the last half decade. That's not a lot of fun for true believers. It's down 2.1% in the last seven days.
View our latest analysis for Tullow Oil
While markets are a powerful pricing mechanism, share prices reflect investor sentiment, not just underlying business performance. One imperfect but simple way to consider how the market perception of a company has shifted is to compare the change in the earnings per share (EPS) with the share price movement.
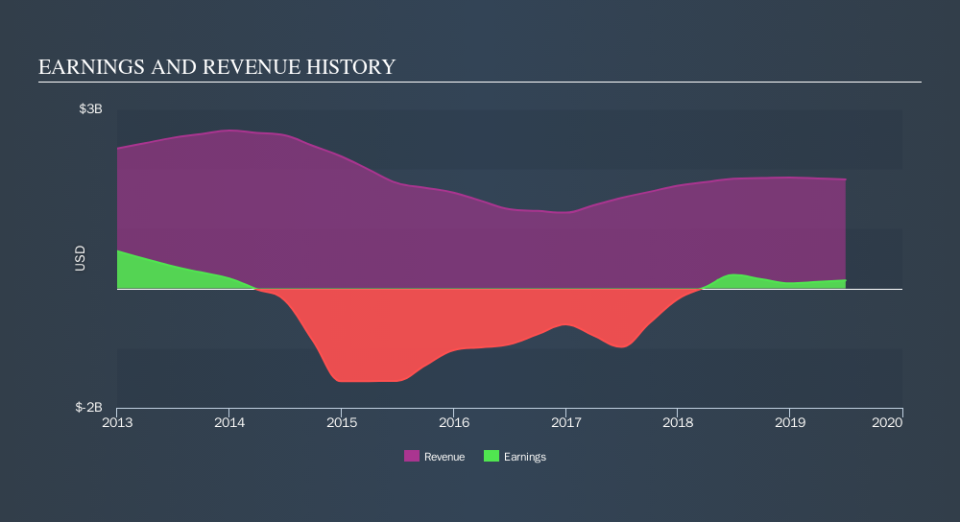
During five years of share price growth, Tullow Oil moved from a loss to profitability. That would generally be considered a positive, so we are surprised to see the share price is down. Other metrics may better explain the share price move.
We don't think that the 1.9% is big factor in the share price, since it's quite small, as dividends go. Arguably, the revenue drop of 4.1% a year for half a decade suggests that the company can't grow in the long term. That could explain the weak share price.
The image below shows how earnings and revenue have tracked over time (if you click on the image you can see greater detail).
Tullow Oil is a well known stock, with plenty of analyst coverage, suggesting some visibility into future growth. So it makes a lot of sense to check out what analysts think Tullow Oil will earn in the future (free analyst consensus estimates)
What About Dividends?
It is important to consider the total shareholder return, as well as the share price return, for any given stock. Whereas the share price return only reflects the change in the share price, the TSR includes the value of dividends (assuming they were reinvested) and the benefit of any discounted capital raising or spin-off. Arguably, the TSR gives a more comprehensive picture of the return generated by a stock. In the case of Tullow Oil, it has a TSR of -51% for the last 5 years. That exceeds its share price return that we previously mentioned. And there's no prize for guessing that the dividend payments largely explain the divergence!
A Different Perspective
Tullow Oil shareholders are down 18% for the year (even including dividends) , but the market itself is up 4.7%. However, keep in mind that even the best stocks will sometimes underperform the market over a twelve month period. Regrettably, last year's performance caps off a bad run, with the shareholders facing a total loss of 13% per year over five years. We realise that Buffett has said investors should 'buy when there is blood on the streets', but we caution that investors should first be sure they are buying a high quality businesses. Most investors take the time to check the data on insider transactions. You can click here to see if insiders have been buying or selling.
Of course, you might find a fantastic investment by looking elsewhere. So take a peek at this free list of companies we expect will grow earnings.
Please note, the market returns quoted in this article reflect the market weighted average returns of stocks that currently trade on GB exchanges.
We aim to bring you long-term focused research analysis driven by fundamental data. Note that our analysis may not factor in the latest price-sensitive company announcements or qualitative material.
If you spot an error that warrants correction, please contact the editor at editorial-team@simplywallst.com. This article by Simply Wall St is general in nature. It does not constitute a recommendation to buy or sell any stock, and does not take account of your objectives, or your financial situation. Simply Wall St has no position in the stocks mentioned. Thank you for reading.
