
 Yahoo Finance
 Limbach Holdings (NASDAQ:LMB) Could Become A Multi-Bagger
If we want to find a stock that could multiply over the long term, what are the underlying trends we should look for? Typically, we'll want to notice a trend of growing return on capital employed (ROCE) and alongside that, an expanding base of capital employed. This shows us that it's a compounding machine, able to continually reinvest its earnings back into the business and generate higher returns. So when we looked at the ROCE trend of Limbach Holdings (NASDAQ:LMB) we really liked what we saw.
Understanding Return On Capital Employed (ROCE)
For those who don't know, ROCE is a measure of a company's yearly pre-tax profit (its return), relative to the capital employed in the business. To calculate this metric for Limbach Holdings, this is the formula:
Return on Capital Employed = Earnings Before Interest and Tax (EBIT) ÷ (Total Assets - Current Liabilities)
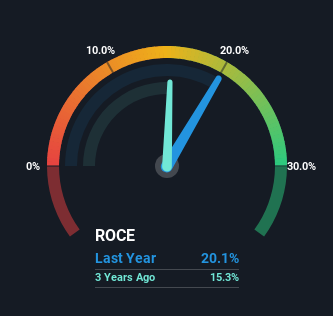
0.20 = US$32m ÷ (US$304m - US$145m) (Based on the trailing twelve months to December 2023).
Therefore, Limbach Holdings has an ROCE of 20%. That's a fantastic return and not only that, it outpaces the average of 12% earned by companies in a similar industry.
View our latest analysis for Limbach Holdings
In the above chart we have measured Limbach Holdings' prior ROCE against its prior performance, but the future is arguably more important. If you'd like, you can check out the forecasts from the analysts covering Limbach Holdings for free.
What The Trend Of ROCE Can Tell Us
We like the trends that we're seeing from Limbach Holdings. The numbers show that in the last five years, the returns generated on capital employed have grown considerably to 20%. The company is effectively making more money per dollar of capital used, and it's worth noting that the amount of capital has increased too, by 123%. The increasing returns on a growing amount of capital is common amongst multi-baggers and that's why we're impressed.
In another part of our analysis, we noticed that the company's ratio of current liabilities to total assets decreased to 48%, which broadly means the business is relying less on its suppliers or short-term creditors to fund its operations. So shareholders would be pleased that the growth in returns has mostly come from underlying business performance. Nevertheless, there are some potential risks the company is bearing with current liabilities that high, so just keep that in mind.
The Bottom Line On Limbach Holdings' ROCE
All in all, it's terrific to see that Limbach Holdings is reaping the rewards from prior investments and is growing its capital base. And a remarkable 355% total return over the last five years tells us that investors are expecting more good things to come in the future. So given the stock has proven it has promising trends, it's worth researching the company further to see if these trends are likely to persist.
If you want to continue researching Limbach Holdings, you might be interested to know about the 1 warning sign that our analysis has discovered.
High returns are a key ingredient to strong performance, so check out our free list ofstocks earning high returns on equity with solid balance sheets.
Have feedback on this article? Concerned about the content? Get in touch with us directly. Alternatively, email editorial-team (at) simplywallst.com.
This article by Simply Wall St is general in nature. We provide commentary based on historical data and analyst forecasts only using an unbiased methodology and our articles are not intended to be financial advice. It does not constitute a recommendation to buy or sell any stock, and does not take account of your objectives, or your financial situation. We aim to bring you long-term focused analysis driven by fundamental data. Note that our analysis may not factor in the latest price-sensitive company announcements or qualitative material. Simply Wall St has no position in any stocks mentioned.
