
 Yahoo Finance
 Liquidia Corporation's (NASDAQ:LQDA) Earnings Haven't Escaped The Attention Of Investors
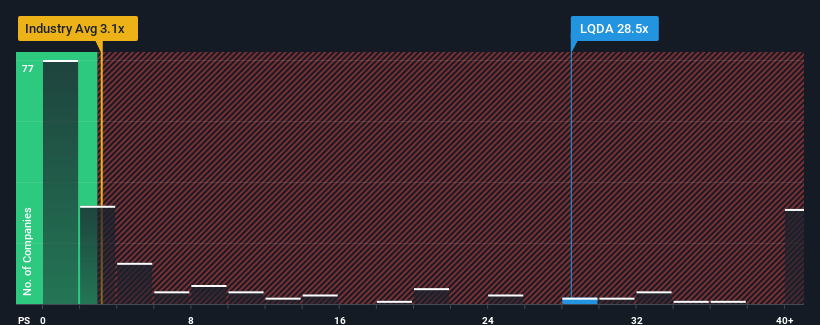
You may think that with a price-to-sales (or "P/S") ratio of 28.5x Liquidia Corporation (NASDAQ:LQDA) is a stock to avoid completely, seeing as almost half of all the Pharmaceuticals companies in the United States have P/S ratios under 3.1x and even P/S lower than 0.9x aren't out of the ordinary. Nonetheless, we'd need to dig a little deeper to determine if there is a rational basis for the highly elevated P/S.
See our latest analysis for Liquidia
How Has Liquidia Performed Recently?
With revenue growth that's superior to most other companies of late, Liquidia has been doing relatively well. The P/S is probably high because investors think this strong revenue performance will continue. You'd really hope so, otherwise you're paying a pretty hefty price for no particular reason.
Want the full picture on analyst estimates for the company? Then our free report on Liquidia will help you uncover what's on the horizon.
How Is Liquidia's Revenue Growth Trending?
In order to justify its P/S ratio, Liquidia would need to produce outstanding growth that's well in excess of the industry.
If we review the last year of revenue growth, the company posted a terrific increase of 24%. The latest three year period has also seen an excellent 97% overall rise in revenue, aided by its short-term performance. Accordingly, shareholders would have definitely welcomed those medium-term rates of revenue growth.
Turning to the outlook, the next three years should generate growth of 100% per year as estimated by the six analysts watching the company. Meanwhile, the rest of the industry is forecast to only expand by 31% per year, which is noticeably less attractive.
In light of this, it's understandable that Liquidia's P/S sits above the majority of other companies. Apparently shareholders aren't keen to offload something that is potentially eyeing a more prosperous future.
What Does Liquidia's P/S Mean For Investors?
It's argued the price-to-sales ratio is an inferior measure of value within certain industries, but it can be a powerful business sentiment indicator.
As we suspected, our examination of Liquidia's analyst forecasts revealed that its superior revenue outlook is contributing to its high P/S. At this stage investors feel the potential for a deterioration in revenues is quite remote, justifying the elevated P/S ratio. It's hard to see the share price falling strongly in the near future under these circumstances.
Having said that, be aware Liquidia is showing 2 warning signs in our investment analysis, you should know about.
It's important to make sure you look for a great company, not just the first idea you come across. So if growing profitability aligns with your idea of a great company, take a peek at this free list of interesting companies with strong recent earnings growth (and a low P/E).
Have feedback on this article? Concerned about the content? Get in touch with us directly. Alternatively, email editorial-team (at) simplywallst.com.
This article by Simply Wall St is general in nature. We provide commentary based on historical data and analyst forecasts only using an unbiased methodology and our articles are not intended to be financial advice. It does not constitute a recommendation to buy or sell any stock, and does not take account of your objectives, or your financial situation. We aim to bring you long-term focused analysis driven by fundamental data. Note that our analysis may not factor in the latest price-sensitive company announcements or qualitative material. Simply Wall St has no position in any stocks mentioned.
Join A Paid User Research Session
You’ll receive a US$30 Amazon Gift card for 1 hour of your time while helping us build better investing tools for the individual investors like yourself. Sign up here
