
 Yahoo Finance
 Little Excitement Around Genting Berhad's (KLSE:GENTING) Revenues
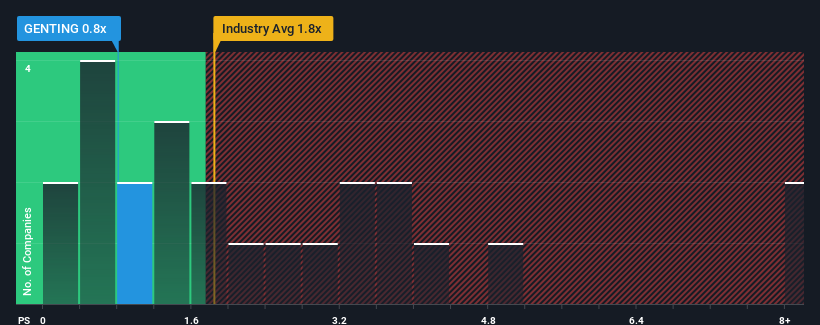
Genting Berhad's (KLSE:GENTING) price-to-sales (or "P/S") ratio of 0.8x might make it look like a buy right now compared to the Hospitality industry in Malaysia, where around half of the companies have P/S ratios above 1.8x and even P/S above 4x are quite common. Although, it's not wise to just take the P/S at face value as there may be an explanation why it's limited.
See our latest analysis for Genting Berhad
What Does Genting Berhad's P/S Mean For Shareholders?
With revenue growth that's inferior to most other companies of late, Genting Berhad has been relatively sluggish. The P/S ratio is probably low because investors think this lacklustre revenue performance isn't going to get any better. If you still like the company, you'd be hoping revenue doesn't get any worse and that you could pick up some stock while it's out of favour.
Want the full picture on analyst estimates for the company? Then our free report on Genting Berhad will help you uncover what's on the horizon.
How Is Genting Berhad's Revenue Growth Trending?
The only time you'd be truly comfortable seeing a P/S as low as Genting Berhad's is when the company's growth is on track to lag the industry.
Retrospectively, the last year delivered an exceptional 65% gain to the company's top line. Although, its longer-term performance hasn't been as strong with three-year revenue growth being relatively non-existent overall. So it appears to us that the company has had a mixed result in terms of growing revenue over that time.
Looking ahead now, revenue is anticipated to climb by 8.8% per year during the coming three years according to the analysts following the company. Meanwhile, the rest of the industry is forecast to expand by 27% per year, which is noticeably more attractive.
With this information, we can see why Genting Berhad is trading at a P/S lower than the industry. Apparently many shareholders weren't comfortable holding on while the company is potentially eyeing a less prosperous future.
The Key Takeaway
Typically, we'd caution against reading too much into price-to-sales ratios when settling on investment decisions, though it can reveal plenty about what other market participants think about the company.
As expected, our analysis of Genting Berhad's analyst forecasts confirms that the company's underwhelming revenue outlook is a major contributor to its low P/S. Right now shareholders are accepting the low P/S as they concede future revenue probably won't provide any pleasant surprises. Unless these conditions improve, they will continue to form a barrier for the share price around these levels.
Plus, you should also learn about this 1 warning sign we've spotted with Genting Berhad.
If these risks are making you reconsider your opinion on Genting Berhad, explore our interactive list of high quality stocks to get an idea of what else is out there.
Have feedback on this article? Concerned about the content? Get in touch with us directly. Alternatively, email editorial-team (at) simplywallst.com.
This article by Simply Wall St is general in nature. We provide commentary based on historical data and analyst forecasts only using an unbiased methodology and our articles are not intended to be financial advice. It does not constitute a recommendation to buy or sell any stock, and does not take account of your objectives, or your financial situation. We aim to bring you long-term focused analysis driven by fundamental data. Note that our analysis may not factor in the latest price-sensitive company announcements or qualitative material. Simply Wall St has no position in any stocks mentioned.
Join A Paid User Research Session
You’ll receive a US$30 Amazon Gift card for 1 hour of your time while helping us build better investing tools for the individual investors like yourself. Sign up here
