
 Yahoo Finance
 Little Excitement Around Kromek Group plc's (LON:KMK) Revenues As Shares Take 29% Pounding
Unfortunately for some shareholders, the Kromek Group plc (LON:KMK) share price has dived 29% in the last thirty days, prolonging recent pain. The recent drop completes a disastrous twelve months for shareholders, who are sitting on a 59% loss during that time.
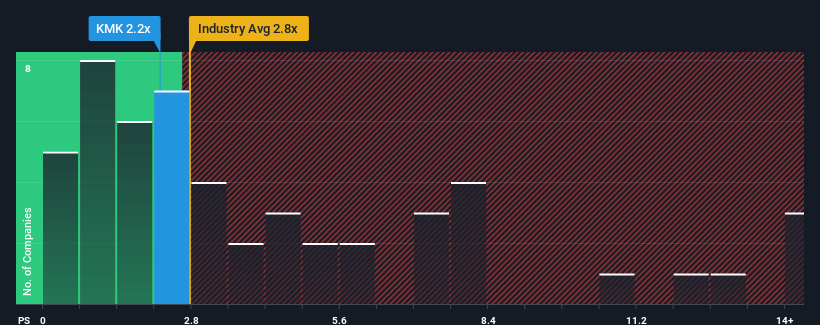
Following the heavy fall in price, Kromek Group may be sending buy signals at present with its price-to-sales (or "P/S") ratio of 2.2x, considering almost half of all companies in the Semiconductor industry in the United Kingdom have P/S ratios greater than 3.9x and even P/S higher than 6x aren't out of the ordinary. Nonetheless, we'd need to dig a little deeper to determine if there is a rational basis for the reduced P/S.
Check out our latest analysis for Kromek Group
What Does Kromek Group's Recent Performance Look Like?
With revenue growth that's inferior to most other companies of late, Kromek Group has been relatively sluggish. It seems that many are expecting the uninspiring revenue performance to persist, which has repressed the growth of the P/S ratio. If this is the case, then existing shareholders will probably struggle to get excited about the future direction of the share price.
Want the full picture on analyst estimates for the company? Then our free report on Kromek Group will help you uncover what's on the horizon.
Is There Any Revenue Growth Forecasted For Kromek Group?
There's an inherent assumption that a company should underperform the industry for P/S ratios like Kromek Group's to be considered reasonable.
If we review the last year of revenue growth, the company posted a terrific increase of 35%. Still, revenue has fallen 13% in total from three years ago, which is quite disappointing. Accordingly, shareholders would have felt downbeat about the medium-term rates of revenue growth.
Turning to the outlook, the next year should generate growth of 38% as estimated by the two analysts watching the company. Meanwhile, the rest of the industry is forecast to expand by 59%, which is noticeably more attractive.
With this information, we can see why Kromek Group is trading at a P/S lower than the industry. It seems most investors are expecting to see limited future growth and are only willing to pay a reduced amount for the stock.
What Does Kromek Group's P/S Mean For Investors?
The southerly movements of Kromek Group's shares means its P/S is now sitting at a pretty low level. It's argued the price-to-sales ratio is an inferior measure of value within certain industries, but it can be a powerful business sentiment indicator.
We've established that Kromek Group maintains its low P/S on the weakness of its forecast growth being lower than the wider industry, as expected. Shareholders' pessimism on the revenue prospects for the company seems to be the main contributor to the depressed P/S. Unless these conditions improve, they will continue to form a barrier for the share price around these levels.
We don't want to rain on the parade too much, but we did also find 5 warning signs for Kromek Group (2 are concerning!) that you need to be mindful of.
It's important to make sure you look for a great company, not just the first idea you come across. So if growing profitability aligns with your idea of a great company, take a peek at this free list of interesting companies with strong recent earnings growth (and a low P/E).
Have feedback on this article? Concerned about the content? Get in touch with us directly. Alternatively, email editorial-team (at) simplywallst.com.
This article by Simply Wall St is general in nature. We provide commentary based on historical data and analyst forecasts only using an unbiased methodology and our articles are not intended to be financial advice. It does not constitute a recommendation to buy or sell any stock, and does not take account of your objectives, or your financial situation. We aim to bring you long-term focused analysis driven by fundamental data. Note that our analysis may not factor in the latest price-sensitive company announcements or qualitative material. Simply Wall St has no position in any stocks mentioned.
Join A Paid User Research Session
You’ll receive a US$30 Amazon Gift card for 1 hour of your time while helping us build better investing tools for the individual investors like yourself. Sign up here
