
 Yahoo Finance
 Little Excitement Around Vericel Corporation's (NASDAQ:VCEL) Revenues
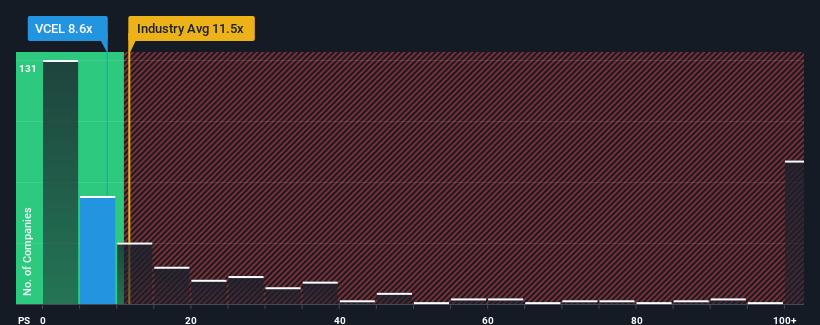
Vericel Corporation's (NASDAQ:VCEL) price-to-sales (or "P/S") ratio of 8.6x might make it look like a buy right now compared to the Biotechs industry in the United States, where around half of the companies have P/S ratios above 11.5x and even P/S above 50x are quite common. Although, it's not wise to just take the P/S at face value as there may be an explanation why it's limited.
View our latest analysis for Vericel
How Has Vericel Performed Recently?
Recent times haven't been great for Vericel as its revenue has been rising slower than most other companies. The P/S ratio is probably low because investors think this lacklustre revenue performance isn't going to get any better. If this is the case, then existing shareholders will probably struggle to get excited about the future direction of the share price.
Want the full picture on analyst estimates for the company? Then our free report on Vericel will help you uncover what's on the horizon.
Is There Any Revenue Growth Forecasted For Vericel?
In order to justify its P/S ratio, Vericel would need to produce sluggish growth that's trailing the industry.
If we review the last year of revenue growth, the company posted a worthy increase of 5.2%. Pleasingly, revenue has also lifted 39% in aggregate from three years ago, partly thanks to the last 12 months of growth. Accordingly, shareholders would have definitely welcomed those medium-term rates of revenue growth.
Turning to the outlook, the next three years should generate growth of 20% each year as estimated by the five analysts watching the company. Meanwhile, the rest of the industry is forecast to expand by 92% each year, which is noticeably more attractive.
With this information, we can see why Vericel is trading at a P/S lower than the industry. It seems most investors are expecting to see limited future growth and are only willing to pay a reduced amount for the stock.
The Final Word
Generally, our preference is to limit the use of the price-to-sales ratio to establishing what the market thinks about the overall health of a company.
As expected, our analysis of Vericel's analyst forecasts confirms that the company's underwhelming revenue outlook is a major contributor to its low P/S. Shareholders' pessimism on the revenue prospects for the company seems to be the main contributor to the depressed P/S. It's hard to see the share price rising strongly in the near future under these circumstances.
Many other vital risk factors can be found on the company's balance sheet. Take a look at our free balance sheet analysis for Vericel with six simple checks on some of these key factors.
It's important to make sure you look for a great company, not just the first idea you come across. So if growing profitability aligns with your idea of a great company, take a peek at this free list of interesting companies with strong recent earnings growth (and a low P/E).
Have feedback on this article? Concerned about the content? Get in touch with us directly. Alternatively, email editorial-team (at) simplywallst.com.
This article by Simply Wall St is general in nature. We provide commentary based on historical data and analyst forecasts only using an unbiased methodology and our articles are not intended to be financial advice. It does not constitute a recommendation to buy or sell any stock, and does not take account of your objectives, or your financial situation. We aim to bring you long-term focused analysis driven by fundamental data. Note that our analysis may not factor in the latest price-sensitive company announcements or qualitative material. Simply Wall St has no position in any stocks mentioned.
Join A Paid User Research Session
You’ll receive a US$30 Amazon Gift card for 1 hour of your time while helping us build better investing tools for the individual investors like yourself. Sign up here
