
 Yahoo Finance
The London location where house prices are rocketing isn't Chelsea — it is Tower Hamlets
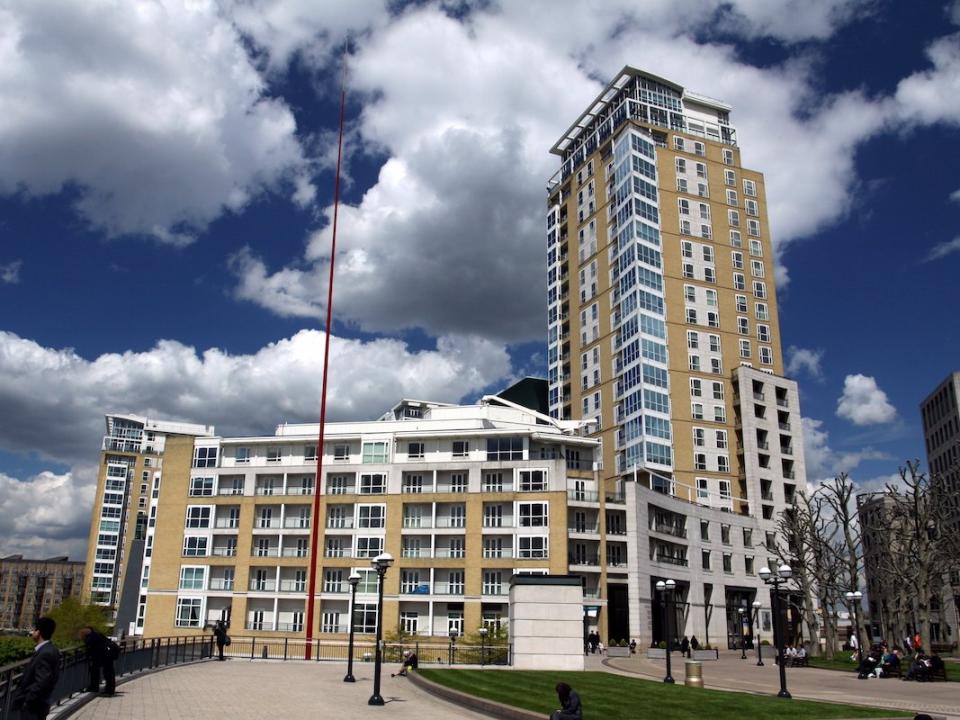
Wikimedia Commons / CC 3.0
LONDON — House prices in prime central London areas may be the highest in the UK, but it's outer areas of the capital like Tower Hamlets where prices are rising the fastest.
Areas in prime central London remain eye-wateringly expensive, with the average house in the exclusive west London borough of Kensington and Chelsea selling for over £1.9 million, according to Rightmove.
However, growth in prime central areas has been slowing for several months, with the likes of Knight Frank measuring drops of up to 14% year-on-year last month.
Meanwhile in outer London prices continue to rise dramatically, albeit from a much lower point — the average house price in the Greater London borough of Tower Hamlets is a comparatively affordable £522,457, according to Rightmove.
Take a look at the graph comparing house price growth in Chelsea and Tower Hamlets between 1995 and 2016.
It's taken from Barclays' latest Housing Chartbook below, which is compiled using Land Registry data, and is expressed as a percentage of each area's average property values in February 1995:
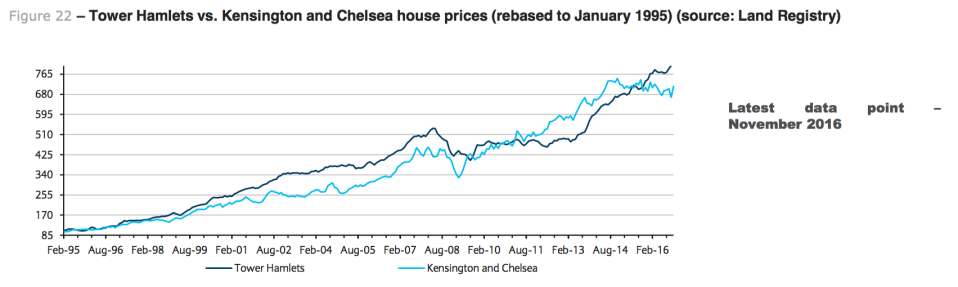
Barclays Housing Chartbook, February 2017
The disparity in growth rates is even more dramatic when the last two years are charted:
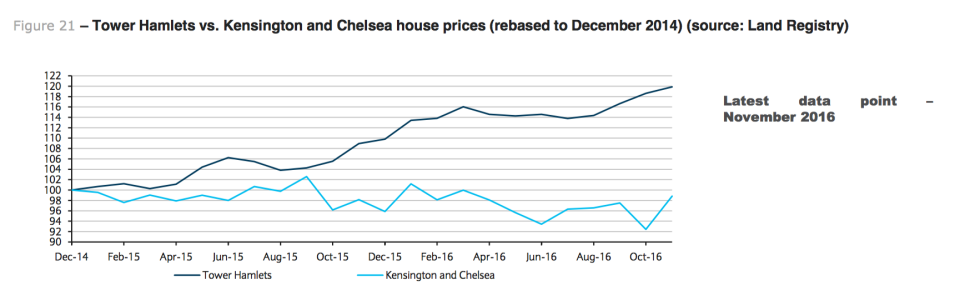
Barclays Housing Chartbook, February 2017
It's a useful example of a wider trend: house price growth in "up-and-coming" areas continues to grow rapidly as buyers are priced out of central locations, while property value the capital's most exclusive boroughs appear to have peaked — at least for now, with Savills predicting a return to growth in 2019.
Rob Weaver, director of investments at property crowdfunding firm Property Partner, said in a statement: "While prime central London has hit something of a wall, outer London boroughs are still recording double-digit price growth.
"The Crossrail effect and certain regeneration areas seem to be having an impact. The closer we get to the stations opening next year, buyer demand should intensify by the attraction of shorter commuting times," he said.
NOW WATCH: This tiny pop-up home can be built in just three hours and costs around £950
See Also:
It now takes 26 years for an average couple with one child to save for a house deposit in London
Britain's former business secretary: It's not globalisation killing jobs — it's technology
Greece will run out of money in July and its creditors can't agree on what to do
SEE ALSO: This is one of London’s smallest houses — and it's on the market for £600,000
