
 Yahoo Finance
 Is LondonMetric Property Plc (LON:LMP) A Smart Choice For Dividend Investors?

Want to participate in a short research study? Help shape the future of investing tools and you could win a $250 gift card!
Dividend paying stocks like LondonMetric Property Plc (LON:LMP) tend to be popular with investors, and for good reason - some research suggests a significant amount of all stock market returns come from reinvested dividends. Yet sometimes, investors buy a stock for its dividend and lose money because the share price falls by more than they earned in dividend payments.
In this case, LondonMetric Property likely looks attractive to investors, given its 3.8% dividend yield and a payment history of over ten years. It would not be a surprise to discover that many investors buy it for the dividends. There are a few simple ways to reduce the risks of buying LondonMetric Property for its dividend, and we'll go through these below.
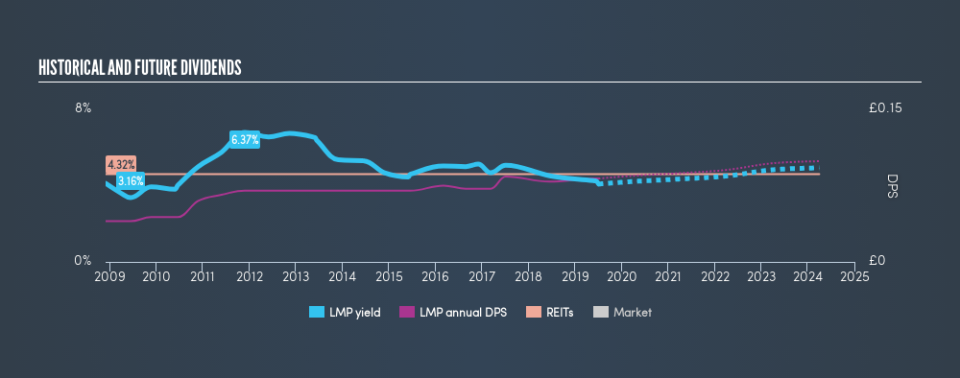
Explore this interactive chart for our latest analysis on LondonMetric Property!
Payout ratios
Dividends are usually paid out of company earnings. If a company is paying more than it earns, then the dividend might become unsustainable - hardly an ideal situation. So we need to form a view on if a company's dividend is sustainable, relative to its net profit after tax. In the last year, LondonMetric Property paid out 93% of its profit as dividends. Paying out a majority of its earnings limits the amount that can be reinvested in the business. This may indicate a commitment to paying a dividend, or a dearth of investment opportunities.
Another important check we do is to see if the free cash flow generated is sufficient to pay the dividend. The company paid out 94% of its free cash flow as dividends last year, which is adequate, but reduces the wriggle room in the event of a downturn. It's encouraging to see that the dividend is covered by both profit and cash flow. This generally suggests the dividend is sustainable, as long as earnings don't drop precipitously.
Is LondonMetric Property's Balance Sheet Risky?
As LondonMetric Property has a meaningful amount of debt, we need to check its balance sheet to see if the company might have debt risks. A rough way to check this is with these two simple ratios: a) net debt divided by EBITDA (earnings before interest, tax, depreciation and amortisation), and b) net interest cover. Net debt to EBITDA is a measure of a company's total debt. Net interest cover measures the ability to meet interest payments. Essentially we check that a) the company does not have too much debt, and b) that it can afford to pay the interest. LondonMetric Property has net debt of 6.86 times its EBITDA, which implies meaningful risk if interest rates rise of earnings decline.
We calculated its interest cover by measuring its earnings before interest and tax (EBIT), and dividing this by the company's net interest expense. Interest cover of 4.83 times its interest expense is starting to become a concern for LondonMetric Property, and be aware that lenders may place additional restrictions on the company as well. Low interest cover and high debt can create problems right when the investor least needs them, and we're reluctant to rely on the dividend of companies with these traits.
Consider getting our latest analysis on LondonMetric Property's financial position here.
Dividend Volatility
From the perspective of an income investor who wants to earn dividends for many years, there is not much point buying a stock if its dividend is regularly cut or is not reliable. LondonMetric Property has been paying dividends for a long time, but for the purpose of this analysis, we only examine the past 10 years of payments. During the past ten-year period, the first annual payment was UK£0.04 in 2009, compared to UK£0.082 last year. This works out to be a compound annual growth rate (CAGR) of approximately 7.4% a year over that time.
Companies like this, growing their dividend at a decent rate, can be very valuable over the long term, if the rate of growth can be maintained.
Dividend Growth Potential
The other half of the dividend investing equation is evaluating whether earnings per share (EPS) are growing. Over the long term, dividends need to grow at or above the rate of inflation, in order to maintain the recipient's purchasing power. Over the past five years, it looks as though LondonMetric Property's EPS have declined at around 3.0% a year. If earnings continue to decline, the dividend may come under pressure. Every investor should make an assessment of whether the company is taking steps to stabilise the situation.
Conclusion
When we look at a dividend stock, we need to form a judgement on whether the dividend will grow, if the company is able to maintain it in a wide range of economic circumstances, and if the dividend payout is sustainable. First, we think LondonMetric Property is paying out an acceptable percentage of its cashflow and profit. Second, earnings per share have actually shrunk, but at least the dividends have been relatively stable. While we're not hugely bearish on it, overall we think there are potentially better dividend stocks than LondonMetric Property out there.
Are management backing themselves to deliver performance? Check their shareholdings in LondonMetric Property in our latest insider ownership analysis.
If you are a dividend investor, you might also want to look at our curated list of dividend stocks yielding above 3%.
We aim to bring you long-term focused research analysis driven by fundamental data. Note that our analysis may not factor in the latest price-sensitive company announcements or qualitative material.
If you spot an error that warrants correction, please contact the editor at editorial-team@simplywallst.com. This article by Simply Wall St is general in nature. It does not constitute a recommendation to buy or sell any stock, and does not take account of your objectives, or your financial situation. Simply Wall St has no position in the stocks mentioned. Thank you for reading.
