
 Yahoo Finance
 A Look At The Fair Value Of Basic-Fit N.V. (AMS:BFIT)
Key Insights
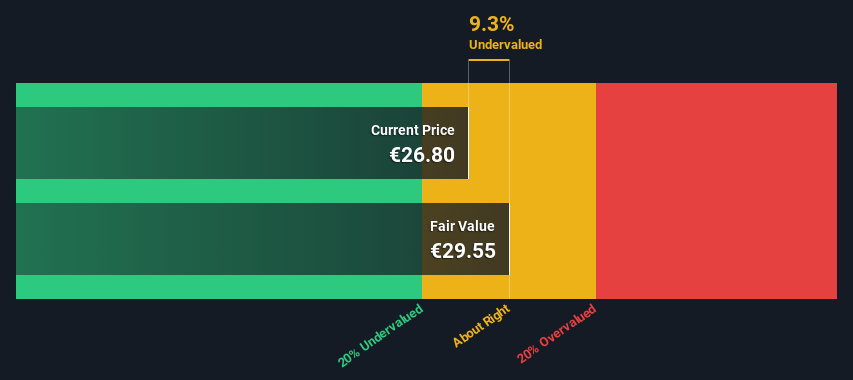
The projected fair value for Basic-Fit is €29.55 based on 2 Stage Free Cash Flow to Equity
Basic-Fit's €26.80 share price indicates it is trading at similar levels as its fair value estimate
Our fair value estimate is 19% lower than Basic-Fit's analyst price target of €36.70
Today we will run through one way of estimating the intrinsic value of Basic-Fit N.V. (AMS:BFIT) by taking the forecast future cash flows of the company and discounting them back to today's value. This will be done using the Discounted Cash Flow (DCF) model. Models like these may appear beyond the comprehension of a lay person, but they're fairly easy to follow.
We generally believe that a company's value is the present value of all of the cash it will generate in the future. However, a DCF is just one valuation metric among many, and it is not without flaws. If you want to learn more about discounted cash flow, the rationale behind this calculation can be read in detail in the Simply Wall St analysis model.
Check out our latest analysis for Basic-Fit
The Model
We are going to use a two-stage DCF model, which, as the name states, takes into account two stages of growth. The first stage is generally a higher growth period which levels off heading towards the terminal value, captured in the second 'steady growth' period. To begin with, we have to get estimates of the next ten years of cash flows. Where possible we use analyst estimates, but when these aren't available we extrapolate the previous free cash flow (FCF) from the last estimate or reported value. We assume companies with shrinking free cash flow will slow their rate of shrinkage, and that companies with growing free cash flow will see their growth rate slow, over this period. We do this to reflect that growth tends to slow more in the early years than it does in later years.
Generally we assume that a dollar today is more valuable than a dollar in the future, so we need to discount the sum of these future cash flows to arrive at a present value estimate:
10-year free cash flow (FCF) estimate
2024 | 2025 | 2026 | 2027 | 2028 | 2029 | 2030 | 2031 | 2032 | 2033 | |
Levered FCF (€, Millions) | €81.9m | €144.6m | €161.1m | €174.2m | €184.6m | €192.6m | €198.8m | €203.7m | €207.6m | €210.8m |
Growth Rate Estimate Source | Analyst x2 | Analyst x2 | Est @ 11.40% | Est @ 8.17% | Est @ 5.92% | Est @ 4.34% | Est @ 3.23% | Est @ 2.46% | Est @ 1.91% | Est @ 1.54% |
Present Value (€, Millions) Discounted @ 9.8% | €74.6 | €120 | €122 | €120 | €116 | €110 | €104 | €96.6 | €89.7 | €83.0 |
("Est" = FCF growth rate estimated by Simply Wall St)
Present Value of 10-year Cash Flow (PVCF) = €1.0b
The second stage is also known as Terminal Value, this is the business's cash flow after the first stage. For a number of reasons a very conservative growth rate is used that cannot exceed that of a country's GDP growth. In this case we have used the 5-year average of the 10-year government bond yield (0.6%) to estimate future growth. In the same way as with the 10-year 'growth' period, we discount future cash flows to today's value, using a cost of equity of 9.8%.
Terminal Value (TV)= FCF2033 × (1 + g) ÷ (r – g) = €211m× (1 + 0.6%) ÷ (9.8%– 0.6%) = €2.3b
Present Value of Terminal Value (PVTV)= TV / (1 + r)10= €2.3b÷ ( 1 + 9.8%)10= €915m
The total value is the sum of cash flows for the next ten years plus the discounted terminal value, which results in the Total Equity Value, which in this case is €2.0b. To get the intrinsic value per share, we divide this by the total number of shares outstanding. Compared to the current share price of €26.8, the company appears about fair value at a 9.3% discount to where the stock price trades currently. Valuations are imprecise instruments though, rather like a telescope - move a few degrees and end up in a different galaxy. Do keep this in mind.
Important Assumptions
We would point out that the most important inputs to a discounted cash flow are the discount rate and of course the actual cash flows. You don't have to agree with these inputs, I recommend redoing the calculations yourself and playing with them. The DCF also does not consider the possible cyclicality of an industry, or a company's future capital requirements, so it does not give a full picture of a company's potential performance. Given that we are looking at Basic-Fit as potential shareholders, the cost of equity is used as the discount rate, rather than the cost of capital (or weighted average cost of capital, WACC) which accounts for debt. In this calculation we've used 9.8%, which is based on a levered beta of 1.824. Beta is a measure of a stock's volatility, compared to the market as a whole. We get our beta from the industry average beta of globally comparable companies, with an imposed limit between 0.8 and 2.0, which is a reasonable range for a stable business.
SWOT Analysis for Basic-Fit
Strength
Debt is well covered by cash flow.
Weakness
Interest payments on debt are not well covered.
Opportunity
Annual earnings are forecast to grow faster than the Dutch market.
Current share price is below our estimate of fair value.
Threat
Revenue is forecast to grow slower than 20% per year.
Looking Ahead:
Although the valuation of a company is important, it is only one of many factors that you need to assess for a company. It's not possible to obtain a foolproof valuation with a DCF model. Instead the best use for a DCF model is to test certain assumptions and theories to see if they would lead to the company being undervalued or overvalued. If a company grows at a different rate, or if its cost of equity or risk free rate changes sharply, the output can look very different. For Basic-Fit, we've put together three important factors you should explore:
Risks: Case in point, we've spotted 3 warning signs for Basic-Fit you should be aware of, and 1 of them can't be ignored.
Management:Have insiders been ramping up their shares to take advantage of the market's sentiment for BFIT's future outlook? Check out our management and board analysis with insights on CEO compensation and governance factors.
Other High Quality Alternatives: Do you like a good all-rounder? Explore our interactive list of high quality stocks to get an idea of what else is out there you may be missing!
PS. Simply Wall St updates its DCF calculation for every Dutch stock every day, so if you want to find the intrinsic value of any other stock just search here.
Have feedback on this article? Concerned about the content? Get in touch with us directly. Alternatively, email editorial-team (at) simplywallst.com.
This article by Simply Wall St is general in nature. We provide commentary based on historical data and analyst forecasts only using an unbiased methodology and our articles are not intended to be financial advice. It does not constitute a recommendation to buy or sell any stock, and does not take account of your objectives, or your financial situation. We aim to bring you long-term focused analysis driven by fundamental data. Note that our analysis may not factor in the latest price-sensitive company announcements or qualitative material. Simply Wall St has no position in any stocks mentioned.
