
 Yahoo Finance
 A Look At The Fair Value Of Bonduelle SA (EPA:BON)

Does the share price for Bonduelle SA (ENXTPA:BON) reflect it’s really worth? Today, I will calculate the stock’s intrinsic value using the discounted cash flow (DCF) method. If you want to learn more about this method, the basis for my calculations can be found in detail in the Simply Wall St analysis model. Also note that this article was written in June 2018 so be sure check the latest calculation for Bonduelle here.
What’s the value?
I use what is known as the 2-stage model, which takes into account the initial higher growth stage of a company’s life cycle and the steadier growth phase over the long run. To start off, I pulled together the analyst consensus estimates of BON’s levered free cash flow (FCF) over the next five years and discounted these figures at the rate of 8.16%. When estimates weren’t available, I’ve extrapolated the average annual growth rate over the previous five years, capped at a reasonable level. This resulted in a present value of 5-year cash flow of €275.64M. Keen to understand how I arrived at this number? Check out our detailed analysis here.
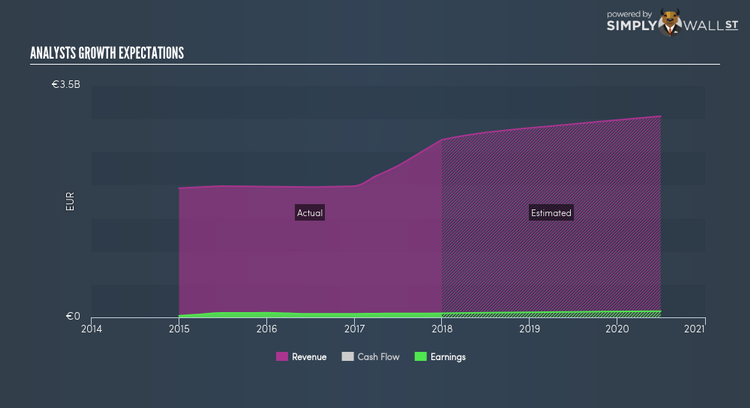
The graph above shows how BON’s earnings are expected to move in the future, which should give you an idea of BON’s outlook. Secondly, I calculate the terminal value, which is the business’s cash flow after the first stage. I think it’s suitable to use the 10-year government bond rate of 2.8% as the steady growth rate, which is rightly below GDP growth, but more towards the conservative side. The present value of the terminal value after discounting it back five years is €782.70M.
The total value is the sum of cash flows for the next five years and the discounted terminal value, which results in the Total Equity Value, which in this case is €1.06B. The last step is to then divide the equity value by the number of shares outstanding. This results in an intrinsic value of €34.18, which, compared to the current share price of €34.5, we find that Bonduelle is fair value, maybe slightly overvalued at the time of writing.
Next Steps:
Whilst important, DCF calculation shouldn’t be the only metric you look at when researching a company.
For BON, I’ve put together three relevant aspects you should further examine:
Financial Health: Does BON have a healthy balance sheet? Take a look at our free balance sheet analysis with six simple checks on key factors like leverage and risk.
Future Earnings: How does BON’s growth rate compare to its peers and the wider market? Dig deeper into the analyst consensus number for the upcoming years by interacting with our free analyst growth expectation chart.
Other High Quality Alternatives: Are there other high quality stocks you could be holding instead of BON? Explore our interactive list of high quality stocks to get an idea of what else is out there you may be missing!
PS. The Simply Wall St app conducts a discounted cash flow for every stock on the ENXTPA every 6 hours. If you want to find the calculation for other stocks just search here.
To help readers see pass the short term volatility of the financial market, we aim to bring you a long-term focused research analysis purely driven by fundamental data. Note that our analysis does not factor in the latest price sensitive company announcements.
The author is an independent contributor and at the time of publication had no position in the stocks mentioned.
