
 Yahoo Finance
 A Look At The Fair Value Of Dukemount Capital Plc (LON:DKE)
Key Insights
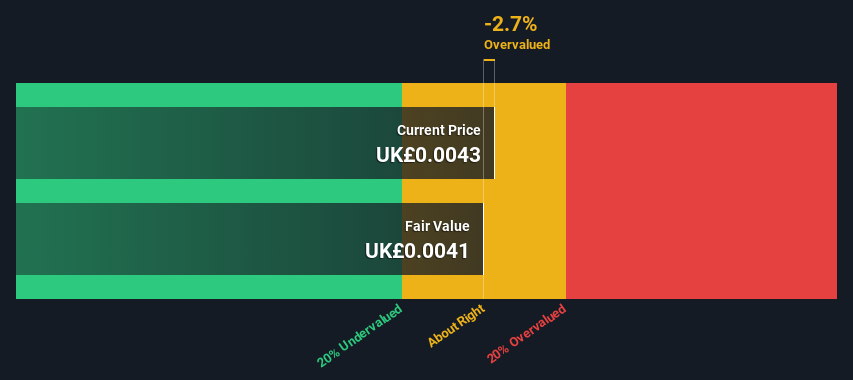
The projected fair value for Dukemount Capital is UK£0.0041 based on 2 Stage Free Cash Flow to Equity
Dukemount Capital's UK£0.0043 share price indicates it is trading at similar levels as its fair value estimate
When compared to theindustry average discount of -146%, Dukemount Capital's competitors seem to be trading at a greater premium to fair value
Today we will run through one way of estimating the intrinsic value of Dukemount Capital Plc (LON:DKE) by taking the expected future cash flows and discounting them to today's value. Our analysis will employ the Discounted Cash Flow (DCF) model. Models like these may appear beyond the comprehension of a lay person, but they're fairly easy to follow.
We would caution that there are many ways of valuing a company and, like the DCF, each technique has advantages and disadvantages in certain scenarios. If you want to learn more about discounted cash flow, the rationale behind this calculation can be read in detail in the Simply Wall St analysis model.
Check out our latest analysis for Dukemount Capital
What's The Estimated Valuation?
We're using the 2-stage growth model, which simply means we take in account two stages of company's growth. In the initial period the company may have a higher growth rate and the second stage is usually assumed to have a stable growth rate. In the first stage we need to estimate the cash flows to the business over the next ten years. Seeing as no analyst estimates of free cash flow are available to us, we have extrapolate the previous free cash flow (FCF) from the company's last reported value. We assume companies with shrinking free cash flow will slow their rate of shrinkage, and that companies with growing free cash flow will see their growth rate slow, over this period. We do this to reflect that growth tends to slow more in the early years than it does in later years.
Generally we assume that a dollar today is more valuable than a dollar in the future, so we need to discount the sum of these future cash flows to arrive at a present value estimate:
10-year free cash flow (FCF) estimate
2024 | 2025 | 2026 | 2027 | 2028 | 2029 | 2030 | 2031 | 2032 | 2033 | |
Levered FCF (£, Millions) | UK£76.2k | UK£99.4k | UK£121.0k | UK£139.9k | UK£155.9k | UK£169.1k | UK£179.8k | UK£188.7k | UK£196.0k | UK£202.3k |
Growth Rate Estimate Source | Est @ 42.75% | Est @ 30.38% | Est @ 21.72% | Est @ 15.66% | Est @ 11.42% | Est @ 8.45% | Est @ 6.37% | Est @ 4.92% | Est @ 3.90% | Est @ 3.18% |
Present Value (£, Millions) Discounted @ 7.7% | UK£0.07 | UK£0.09 | UK£0.1 | UK£0.1 | UK£0.1 | UK£0.1 | UK£0.1 | UK£0.1 | UK£0.1 | UK£0.1 |
("Est" = FCF growth rate estimated by Simply Wall St)
Present Value of 10-year Cash Flow (PVCF) = UK£980k
After calculating the present value of future cash flows in the initial 10-year period, we need to calculate the Terminal Value, which accounts for all future cash flows beyond the first stage. The Gordon Growth formula is used to calculate Terminal Value at a future annual growth rate equal to the 5-year average of the 10-year government bond yield of 1.5%. We discount the terminal cash flows to today's value at a cost of equity of 7.7%.
Terminal Value (TV)= FCF2033 × (1 + g) ÷ (r – g) = UK£202k× (1 + 1.5%) ÷ (7.7%– 1.5%) = UK£3.3m
Present Value of Terminal Value (PVTV)= TV / (1 + r)10= UK£3.3m÷ ( 1 + 7.7%)10= UK£1.6m
The total value is the sum of cash flows for the next ten years plus the discounted terminal value, which results in the Total Equity Value, which in this case is UK£2.6m. The last step is to then divide the equity value by the number of shares outstanding. Relative to the current share price of UK£0.004, the company appears around fair value at the time of writing. The assumptions in any calculation have a big impact on the valuation, so it is better to view this as a rough estimate, not precise down to the last cent.
The Assumptions
The calculation above is very dependent on two assumptions. The first is the discount rate and the other is the cash flows. Part of investing is coming up with your own evaluation of a company's future performance, so try the calculation yourself and check your own assumptions. The DCF also does not consider the possible cyclicality of an industry, or a company's future capital requirements, so it does not give a full picture of a company's potential performance. Given that we are looking at Dukemount Capital as potential shareholders, the cost of equity is used as the discount rate, rather than the cost of capital (or weighted average cost of capital, WACC) which accounts for debt. In this calculation we've used 7.7%, which is based on a levered beta of 1.051. Beta is a measure of a stock's volatility, compared to the market as a whole. We get our beta from the industry average beta of globally comparable companies, with an imposed limit between 0.8 and 2.0, which is a reasonable range for a stable business.
SWOT Analysis for Dukemount Capital
Strength
Currently debt free.
Weakness
Current share price is above our estimate of fair value.
Opportunity
DKE's financial characteristics indicate limited near-term opportunities for shareholders.
Lack of analyst coverage makes it difficult to determine DKE's earnings prospects.
Threat
Total liabilities exceed total assets, which raises the risk of financial distress.
Looking Ahead:
Whilst important, the DCF calculation shouldn't be the only metric you look at when researching a company. The DCF model is not a perfect stock valuation tool. Rather it should be seen as a guide to "what assumptions need to be true for this stock to be under/overvalued?" For instance, if the terminal value growth rate is adjusted slightly, it can dramatically alter the overall result. For Dukemount Capital, there are three additional aspects you should consider:
Risks: For example, we've discovered 6 warning signs for Dukemount Capital (5 are concerning!) that you should be aware of before investing here.
Other Solid Businesses: Low debt, high returns on equity and good past performance are fundamental to a strong business. Why not explore our interactive list of stocks with solid business fundamentals to see if there are other companies you may not have considered!
Other Top Analyst Picks: Interested to see what the analysts are thinking? Take a look at our interactive list of analysts' top stock picks to find out what they feel might have an attractive future outlook!
PS. Simply Wall St updates its DCF calculation for every British stock every day, so if you want to find the intrinsic value of any other stock just search here.
Have feedback on this article? Concerned about the content? Get in touch with us directly. Alternatively, email editorial-team (at) simplywallst.com.
This article by Simply Wall St is general in nature. We provide commentary based on historical data and analyst forecasts only using an unbiased methodology and our articles are not intended to be financial advice. It does not constitute a recommendation to buy or sell any stock, and does not take account of your objectives, or your financial situation. We aim to bring you long-term focused analysis driven by fundamental data. Note that our analysis may not factor in the latest price-sensitive company announcements or qualitative material. Simply Wall St has no position in any stocks mentioned.
