
 Yahoo Finance
 A Look At The Fair Value Of Huntsworth plc (LON:HNT)

Today I will be providing a simple run through of a valuation method used to estimate the attractiveness of Huntsworth plc (LON:HNT) as an investment opportunity by projecting its future cash flows and then discounting them to today’s value. I will be using the Discounted Cash Flows (DCF) model. It may sound complicated, but actually it is quite simple! Anyone interested in learning a bit more about intrinsic value should have a read of the Simply Wall St analysis model. If you are reading this and its not June 2018 then I highly recommend you check out the latest calculation for Huntsworth by following the link below. View out our latest analysis for Huntsworth
The calculation
I’m using the 2-stage growth model, which simply means we take in account two stages of company’s growth. In the initial period the company may have a higher growth rate and the second stage is usually assumed to have perpetual stable growth rate. To start off with we need to estimate the next five years of cash flows. Where possible I use analyst estimates, but when these aren’t available I have extrapolated the previous free cash flow (FCF) from the year before. For this growth rate I used the average annual growth rate over the past five years, but capped at a reasonable level. I then discount this to its value today and sum up the total to get the present value of these cash flows.
5-year cash flow estimate
2018 | 2019 | 2020 | 2021 | 2022 | |
Levered FCF (£, Millions) | £22.43 | £25.90 | £28.70 | £29.40 | £30.11 |
Source | Analyst x3 | Analyst x3 | Analyst x3 | Extrapolated @ (2.43%) | Extrapolated @ (2.43%) |
Present Value Discounted @ 8.28% | £20.72 | £22.09 | £22.61 | £21.39 | £20.23 |
Present Value of 5-year Cash Flow (PVCF)= UK£107.03m
The second stage is also known as Terminal Value, this is the business’s cash flow after the first stage. The Gordon Growth formula is used to calculate Terminal Value at an annual growth rate equal to the 10-year government bond rate of 1.4%. We discount this to today’s value at a cost of equity of 8.3%.
Terminal Value (TV) = FCF2022 × (1 + g) ÷ (r – g) = UK£30.11m × (1 + 1.4%) ÷ (8.3% – 1.4%) = UK£443.61m
Present Value of Terminal Value (PVTV) = TV / (1 + r)5 = UK£443.61m ÷ ( 1 + 8.3%)5 = UK£298.04m
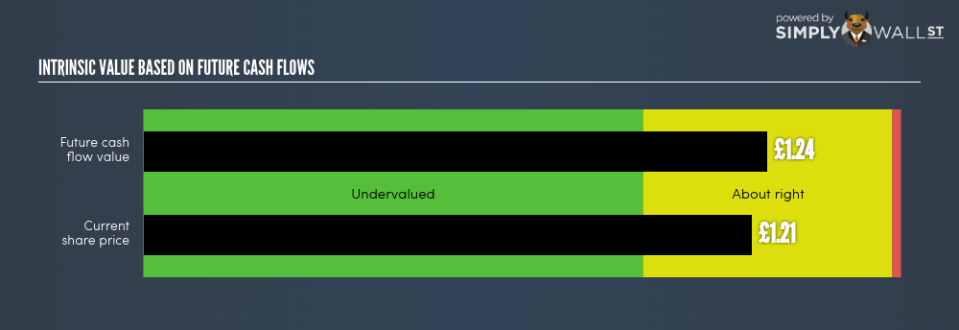
The total value is the sum of cash flows for the next five years and the discounted terminal value, which results in the Total Equity Value, which in this case is UK£405.07m. To get the intrinsic value per share, we divide this by the total number of shares outstanding, or the equivalent number if this is a depositary receipt or ADR. This results in an intrinsic value of £1.24. Compared to the current share price of £1.21, the stock is about right, perhaps slightly undervalued at a 2.50% discount to what it is available for right now.
The assumptions
The calculation above is very dependent on two assumptions. The first is the discount rate and the other is the cash flows. You don’t have to agree with my inputs, I recommend redoing the calculations yourself and playing with them. Because we are looking at Huntsworth as potential shareholders, the cost of equity is used as the discount rate, rather than the cost of capital (or weighed average cost of capital, WACC) which accounts for debt. In this calculation I’ve used 8.3%, which is based on a levered beta of 0.800. This is derived from the Bottom-Up Beta method based on comparable companies, with an imposed limit between 0.8 and 2.0, which is a reasonable range for a stable business.
Next Steps:
Although the valuation of a company is important, it shouldn’t be the only metric you look at when researching a company. For HNT, I’ve put together three key factors you should further research:
Financial Health: Does HNT have a healthy balance sheet? Take a look at our free balance sheet analysis with six simple checks on key factors like leverage and risk.
Future Earnings: How does HNT’s growth rate compare to its peers and the wider market? Dig deeper into the analyst consensus number for the upcoming years by interacting with our free analyst growth expectation chart.
Other High Quality Alternatives: Are there other high quality stocks you could be holding instead of HNT? Explore our interactive list of high quality stocks to get an idea of what else is out there you may be missing!
PS. The Simply Wall St app conducts a discounted cash flow for every stock on the LON every 6 hours. If you want to find the calculation for other stocks just search here.
To help readers see pass the short term volatility of the financial market, we aim to bring you a long-term focused research analysis purely driven by fundamental data. Note that our analysis does not factor in the latest price sensitive company announcements.
The author is an independent contributor and at the time of publication had no position in the stocks mentioned.
