
 Yahoo Finance
 A Look At The Fair Value Of The RealReal, Inc. (NASDAQ:REAL)
Key Insights
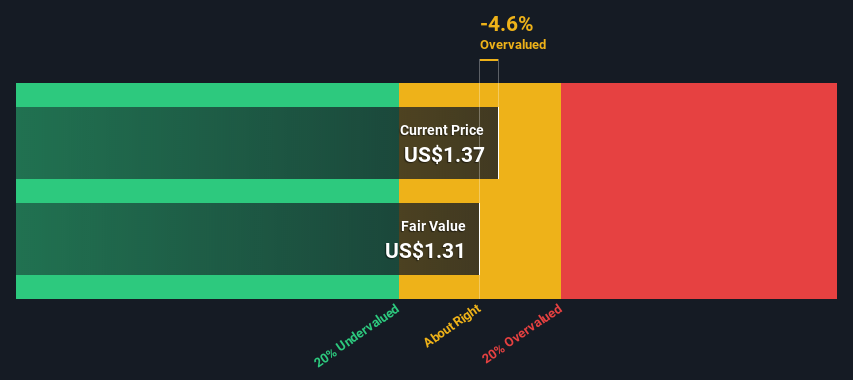
The projected fair value for RealReal is US$1.31 based on 2 Stage Free Cash Flow to Equity
RealReal's US$1.37 share price indicates it is trading at similar levels as its fair value estimate
Analyst price target for REAL is US$2.27, which is 73% above our fair value estimate
Today we'll do a simple run through of a valuation method used to estimate the attractiveness of The RealReal, Inc. (NASDAQ:REAL) as an investment opportunity by projecting its future cash flows and then discounting them to today's value. Our analysis will employ the Discounted Cash Flow (DCF) model. Before you think you won't be able to understand it, just read on! It's actually much less complex than you'd imagine.
Remember though, that there are many ways to estimate a company's value, and a DCF is just one method. If you still have some burning questions about this type of valuation, take a look at the Simply Wall St analysis model.
Check out our latest analysis for RealReal
What's The Estimated Valuation?
We are going to use a two-stage DCF model, which, as the name states, takes into account two stages of growth. The first stage is generally a higher growth period which levels off heading towards the terminal value, captured in the second 'steady growth' period. To begin with, we have to get estimates of the next ten years of cash flows. Where possible we use analyst estimates, but when these aren't available we extrapolate the previous free cash flow (FCF) from the last estimate or reported value. We assume companies with shrinking free cash flow will slow their rate of shrinkage, and that companies with growing free cash flow will see their growth rate slow, over this period. We do this to reflect that growth tends to slow more in the early years than it does in later years.
Generally we assume that a dollar today is more valuable than a dollar in the future, so we discount the value of these future cash flows to their estimated value in today's dollars:
10-year free cash flow (FCF) forecast
2023 | 2024 | 2025 | 2026 | 2027 | 2028 | 2029 | 2030 | 2031 | 2032 | |
Levered FCF ($, Millions) | -US$132.6m | -US$42.8m | -US$30.0m | US$3.00m | US$18.0m | US$29.7m | US$43.4m | US$57.7m | US$71.3m | US$83.6m |
Growth Rate Estimate Source | Analyst x3 | Analyst x3 | Analyst x1 | Analyst x1 | Analyst x1 | Est @ 64.97% | Est @ 46.11% | Est @ 32.91% | Est @ 23.67% | Est @ 17.20% |
Present Value ($, Millions) Discounted @ 14% | -US$116 | -US$32.9 | -US$20.3 | US$1.8 | US$9.4 | US$13.5 | US$17.4 | US$20.2 | US$21.9 | US$22.6 |
("Est" = FCF growth rate estimated by Simply Wall St)
Present Value of 10-year Cash Flow (PVCF) = -US$63m
We now need to calculate the Terminal Value, which accounts for all the future cash flows after this ten year period. For a number of reasons a very conservative growth rate is used that cannot exceed that of a country's GDP growth. In this case we have used the 5-year average of the 10-year government bond yield (2.1%) to estimate future growth. In the same way as with the 10-year 'growth' period, we discount future cash flows to today's value, using a cost of equity of 14%.
Terminal Value (TV)= FCF2032 × (1 + g) ÷ (r – g) = US$84m× (1 + 2.1%) ÷ (14%– 2.1%) = US$718m
Present Value of Terminal Value (PVTV)= TV / (1 + r)10= US$718m÷ ( 1 + 14%)10= US$194m
The total value is the sum of cash flows for the next ten years plus the discounted terminal value, which results in the Total Equity Value, which in this case is US$131m. The last step is to then divide the equity value by the number of shares outstanding. Relative to the current share price of US$1.4, the company appears around fair value at the time of writing. Remember though, that this is just an approximate valuation, and like any complex formula - garbage in, garbage out.
The Assumptions
Now the most important inputs to a discounted cash flow are the discount rate, and of course, the actual cash flows. You don't have to agree with these inputs, I recommend redoing the calculations yourself and playing with them. The DCF also does not consider the possible cyclicality of an industry, or a company's future capital requirements, so it does not give a full picture of a company's potential performance. Given that we are looking at RealReal as potential shareholders, the cost of equity is used as the discount rate, rather than the cost of capital (or weighted average cost of capital, WACC) which accounts for debt. In this calculation we've used 14%, which is based on a levered beta of 2.000. Beta is a measure of a stock's volatility, compared to the market as a whole. We get our beta from the industry average beta of globally comparable companies, with an imposed limit between 0.8 and 2.0, which is a reasonable range for a stable business.
SWOT Analysis for RealReal
Strength
Debt is well covered by earnings.
Weakness
Shareholders have been diluted in the past year.
Opportunity
Forecast to reduce losses next year.
Good value based on P/S ratio compared to estimated Fair P/S ratio.
Threat
Debt is not well covered by operating cash flow.
Has less than 3 years of cash runway based on current free cash flow.
Total liabilities exceed total assets, which raises the risk of financial distress.
Not expected to become profitable over the next 3 years.
Next Steps:
Whilst important, the DCF calculation is only one of many factors that you need to assess for a company. DCF models are not the be-all and end-all of investment valuation. Instead the best use for a DCF model is to test certain assumptions and theories to see if they would lead to the company being undervalued or overvalued. If a company grows at a different rate, or if its cost of equity or risk free rate changes sharply, the output can look very different. For RealReal, we've put together three fundamental items you should consider:
Risks: For example, we've discovered 4 warning signs for RealReal (1 doesn't sit too well with us!) that you should be aware of before investing here.
Future Earnings: How does REAL's growth rate compare to its peers and the wider market? Dig deeper into the analyst consensus number for the upcoming years by interacting with our free analyst growth expectation chart.
Other High Quality Alternatives: Do you like a good all-rounder? Explore our interactive list of high quality stocks to get an idea of what else is out there you may be missing!
PS. Simply Wall St updates its DCF calculation for every American stock every day, so if you want to find the intrinsic value of any other stock just search here.
Have feedback on this article? Concerned about the content? Get in touch with us directly. Alternatively, email editorial-team (at) simplywallst.com.
This article by Simply Wall St is general in nature. We provide commentary based on historical data and analyst forecasts only using an unbiased methodology and our articles are not intended to be financial advice. It does not constitute a recommendation to buy or sell any stock, and does not take account of your objectives, or your financial situation. We aim to bring you long-term focused analysis driven by fundamental data. Note that our analysis may not factor in the latest price-sensitive company announcements or qualitative material. Simply Wall St has no position in any stocks mentioned.
Join A Paid User Research Session
You’ll receive a US$30 Amazon Gift card for 1 hour of your time while helping us build better investing tools for the individual investors like yourself. Sign up here
