
 Yahoo Finance
 How To Look At Hamborner REIT AG (ETR:HAB)

Hamborner REIT AG is a €695m small-cap, real estate investment trust (REIT) based in Duisburg, Germany. REITs are basically a portfolio of income-producing real estate investments, which are owned and operated by management of that trust company. They have to meet certain requirements in order to become a REIT, meaning they should be analyzed a different way. Below, I’ll look at a few important metrics to keep in mind as part of your research on HAB.
See our latest analysis for Hamborner REIT
Funds from Operations (FFO) is a higher quality measure of HAB’s earnings compared to net income. This term is very common in the REIT investing world as it provides a cleaner look at its cash flow from daily operations by excluding impact of one-off activities or non-cash items such as depreciation. For HAB, its FFO of €59m makes up 91% of its gross profit, which means the majority of its earnings are high-quality and recurring.
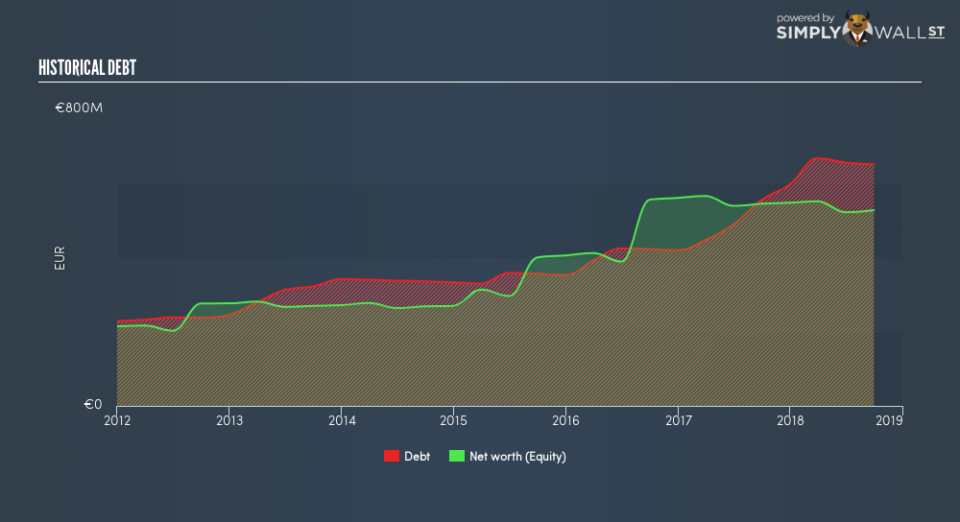
In order to understand whether HAB has a healthy balance sheet, we have to look at a metric called FFO-to-total debt. This tells us how long it will take HAB to pay off its debt using its income from its main business activities, and gives us an insight into HAB’s ability to service its borrowings. With a ratio of 9.9%, the credit rating agency Standard & Poor would consider this as aggressive risk. This would take HAB 10.06 years to pay off using just operating income, which is a long time, and risk increases with time. But realistically, companies have many levers to pull in order to pay back their debt, beyond operating income alone.
I also look at HAB’s interest coverage ratio, which demonstrates how many times its earnings can cover its yearly interest expense. This is similar to the concept above, but looks at the upcoming obligations. The ratio is typically calculated using EBIT, but for a REIT stock, it’s better to use FFO divided by net interest. With an interest coverage ratio of 3.98x, it’s safe to say HAB is generating an appropriate amount of cash from its borrowings.
In terms of valuing HAB, FFO can also be used as a form of relative valuation. Instead of the P/E ratio, P/FFO is used instead, which is very common for REIT stocks. In HAB’s case its P/FFO is 11.68x, compared to the long-term industry average of 16.5x, meaning that it is undervalued.
Next Steps:
Hamborner REIT can bring diversification into your portfolio due to its unique REIT characteristics. Before you make a decision on the stock today, keep in mind I’ve only covered one metric in this article, the FFO, which is by no means comprehensive. I’d strongly recommend continuing your research on the following areas I believe are key fundamentals for HAB:
Future Outlook: What are well-informed industry analysts predicting for HAB’s future growth? Take a look at our free research report of analyst consensus for HAB’s outlook.
Valuation: What is HAB worth today? Is the stock undervalued, even when its growth outlook is factored into its intrinsic value? The intrinsic value infographic in our free research report helps visualize whether HAB is currently mispriced by the market.
Other High-Performing Stocks: Are there other stocks that provide better prospects with proven track records? Explore our free list of these great stocks here.
To help readers see past the short term volatility of the financial market, we aim to bring you a long-term focused research analysis purely driven by fundamental data. Note that our analysis does not factor in the latest price-sensitive company announcements.
The author is an independent contributor and at the time of publication had no position in the stocks mentioned. For errors that warrant correction please contact the editor at editorial-team@simplywallst.com.
