
 Yahoo Finance
 A Look At The Intrinsic Value Of DCD Media Plc (LON:DCD)
In this article we are going to estimate the intrinsic value of DCD Media Plc (LON:DCD) by taking the expected future cash flows and discounting them to their present value. We will take advantage of the Discounted Cash Flow (DCF) model for this purpose. Believe it or not, it's not too difficult to follow, as you'll see from our example!
Remember though, that there are many ways to estimate a company's value, and a DCF is just one method. Anyone interested in learning a bit more about intrinsic value should have a read of the Simply Wall St analysis model.
Check out our latest analysis for DCD Media
The model
We're using the 2-stage growth model, which simply means we take in account two stages of company's growth. In the initial period the company may have a higher growth rate and the second stage is usually assumed to have a stable growth rate. To start off with, we need to estimate the next ten years of cash flows. Seeing as no analyst estimates of free cash flow are available to us, we have extrapolate the previous free cash flow (FCF) from the company's last reported value. We assume companies with shrinking free cash flow will slow their rate of shrinkage, and that companies with growing free cash flow will see their growth rate slow, over this period. We do this to reflect that growth tends to slow more in the early years than it does in later years.
A DCF is all about the idea that a dollar in the future is less valuable than a dollar today, so we need to discount the sum of these future cash flows to arrive at a present value estimate:
10-year free cash flow (FCF) forecast
2022 | 2023 | 2024 | 2025 | 2026 | 2027 | 2028 | 2029 | 2030 | 2031 | |
Levered FCF (£, Millions) | UK£454.7k | UK£362.0k | UK£311.4k | UK£281.7k | UK£263.6k | UK£252.5k | UK£245.7k | UK£241.7k | UK£239.6k | UK£238.8k |
Growth Rate Estimate Source | Est @ -29.48% | Est @ -20.37% | Est @ -14% | Est @ -9.53% | Est @ -6.41% | Est @ -4.22% | Est @ -2.69% | Est @ -1.62% | Est @ -0.87% | Est @ -0.35% |
Present Value (£, Millions) Discounted @ 5.6% | UK£0.4 | UK£0.3 | UK£0.3 | UK£0.2 | UK£0.2 | UK£0.2 | UK£0.2 | UK£0.2 | UK£0.1 | UK£0.1 |
("Est" = FCF growth rate estimated by Simply Wall St)
Present Value of 10-year Cash Flow (PVCF) = UK£2.0m
The second stage is also known as Terminal Value, this is the business's cash flow after the first stage. The Gordon Growth formula is used to calculate Terminal Value at a future annual growth rate equal to the 5-year average of the 10-year government bond yield of 0.9%. We discount the terminal cash flows to today's value at a cost of equity of 5.6%.
Terminal Value (TV)= FCF2031 × (1 + g) ÷ (r – g) = UK£239k× (1 + 0.9%) ÷ (5.6%– 0.9%) = UK£5.1m
Present Value of Terminal Value (PVTV)= TV / (1 + r)10= UK£5.1m÷ ( 1 + 5.6%)10= UK£3.0m
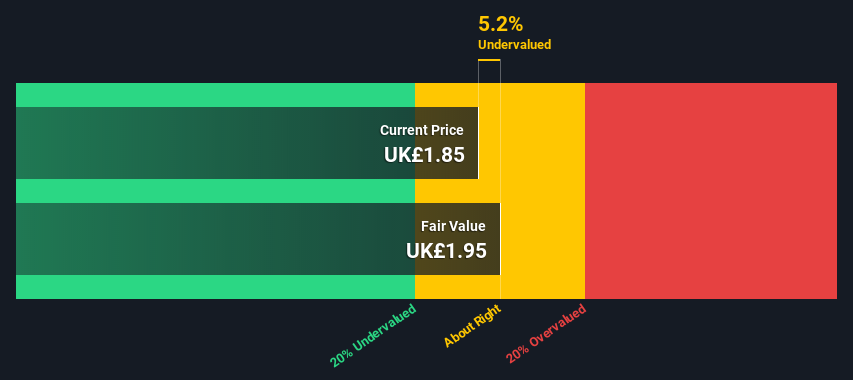
The total value, or equity value, is then the sum of the present value of the future cash flows, which in this case is UK£5.0m. In the final step we divide the equity value by the number of shares outstanding. Relative to the current share price of UK£1.9, the company appears about fair value at a 5.2% discount to where the stock price trades currently. Remember though, that this is just an approximate valuation, and like any complex formula - garbage in, garbage out.
Important assumptions
We would point out that the most important inputs to a discounted cash flow are the discount rate and of course the actual cash flows. Part of investing is coming up with your own evaluation of a company's future performance, so try the calculation yourself and check your own assumptions. The DCF also does not consider the possible cyclicality of an industry, or a company's future capital requirements, so it does not give a full picture of a company's potential performance. Given that we are looking at DCD Media as potential shareholders, the cost of equity is used as the discount rate, rather than the cost of capital (or weighted average cost of capital, WACC) which accounts for debt. In this calculation we've used 5.6%, which is based on a levered beta of 0.977. Beta is a measure of a stock's volatility, compared to the market as a whole. We get our beta from the industry average beta of globally comparable companies, with an imposed limit between 0.8 and 2.0, which is a reasonable range for a stable business.
Looking Ahead:
Whilst important, the DCF calculation is only one of many factors that you need to assess for a company. It's not possible to obtain a foolproof valuation with a DCF model. Rather it should be seen as a guide to "what assumptions need to be true for this stock to be under/overvalued?" For example, changes in the company's cost of equity or the risk free rate can significantly impact the valuation. For DCD Media, there are three additional aspects you should further research:
Risks: Take risks, for example - DCD Media has 1 warning sign we think you should be aware of.
Other Solid Businesses: Low debt, high returns on equity and good past performance are fundamental to a strong business. Why not explore our interactive list of stocks with solid business fundamentals to see if there are other companies you may not have considered!
Other Environmentally-Friendly Companies: Concerned about the environment and think consumers will buy eco-friendly products more and more? Browse through our interactive list of companies that are thinking about a greener future to discover some stocks you may not have thought of!
PS. The Simply Wall St app conducts a discounted cash flow valuation for every stock on the AIM every day. If you want to find the calculation for other stocks just search here.
Have feedback on this article? Concerned about the content? Get in touch with us directly. Alternatively, email editorial-team (at) simplywallst.com.
This article by Simply Wall St is general in nature. We provide commentary based on historical data and analyst forecasts only using an unbiased methodology and our articles are not intended to be financial advice. It does not constitute a recommendation to buy or sell any stock, and does not take account of your objectives, or your financial situation. We aim to bring you long-term focused analysis driven by fundamental data. Note that our analysis may not factor in the latest price-sensitive company announcements or qualitative material. Simply Wall St has no position in any stocks mentioned.
