
 Yahoo Finance
 A Look At Prudential's(LON:PRU) Total Shareholder Returns
Prudential plc (LON:PRU) shareholders should be happy to see the share price up 25% in the last quarter. But that cannot eclipse the less-than-impressive returns over the last three years. In fact, the share price is down 27% in the last three years, falling well short of the market return.
Check out our latest analysis for Prudential
To paraphrase Benjamin Graham: Over the short term the market is a voting machine, but over the long term it's a weighing machine. One imperfect but simple way to consider how the market perception of a company has shifted is to compare the change in the earnings per share (EPS) with the share price movement.
During the three years that the share price fell, Prudential's earnings per share (EPS) dropped by 29% each year. This fall in the EPS is worse than the 10% compound annual share price fall. This suggests that the market retains some optimism around long term earnings stability, despite past EPS declines.
You can see below how EPS has changed over time (discover the exact values by clicking on the image).
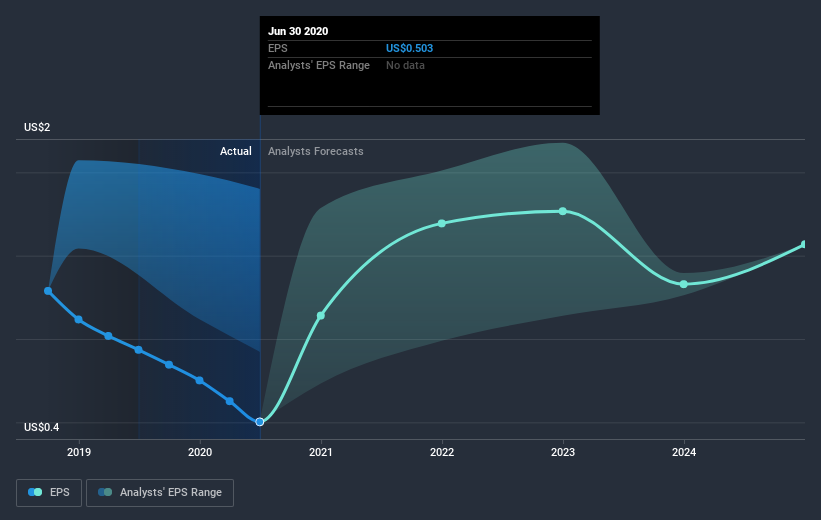
It might be well worthwhile taking a look at our free report on Prudential's earnings, revenue and cash flow.
What About Dividends?
As well as measuring the share price return, investors should also consider the total shareholder return (TSR). The TSR is a return calculation that accounts for the value of cash dividends (assuming that any dividend received was reinvested) and the calculated value of any discounted capital raisings and spin-offs. So for companies that pay a generous dividend, the TSR is often a lot higher than the share price return. As it happens, Prudential's TSR for the last 3 years was -6.5%, which exceeds the share price return mentioned earlier. The dividends paid by the company have thusly boosted the total shareholder return.
A Different Perspective
Although it hurts that Prudential returned a loss of 2.2% in the last twelve months, the broader market was actually worse, returning a loss of 4.9%. Longer term investors wouldn't be so upset, since they would have made 6%, each year, over five years. It could be that the business is just facing some short term problems, but shareholders should keep a close eye on the fundamentals. It's always interesting to track share price performance over the longer term. But to understand Prudential better, we need to consider many other factors. Even so, be aware that Prudential is showing 3 warning signs in our investment analysis , and 1 of those is concerning...
We will like Prudential better if we see some big insider buys. While we wait, check out this free list of growing companies with considerable, recent, insider buying.
Please note, the market returns quoted in this article reflect the market weighted average returns of stocks that currently trade on GB exchanges.
This article by Simply Wall St is general in nature. It does not constitute a recommendation to buy or sell any stock, and does not take account of your objectives, or your financial situation. We aim to bring you long-term focused analysis driven by fundamental data. Note that our analysis may not factor in the latest price-sensitive company announcements or qualitative material. Simply Wall St has no position in any stocks mentioned.
Have feedback on this article? Concerned about the content? Get in touch with us directly. Alternatively, email editorial-team (at) simplywallst.com.
