
 Yahoo Finance
 The Lovesac Company (NASDAQ:LOVE) Shares Could Be 38% Below Their Intrinsic Value Estimate
Key Insights
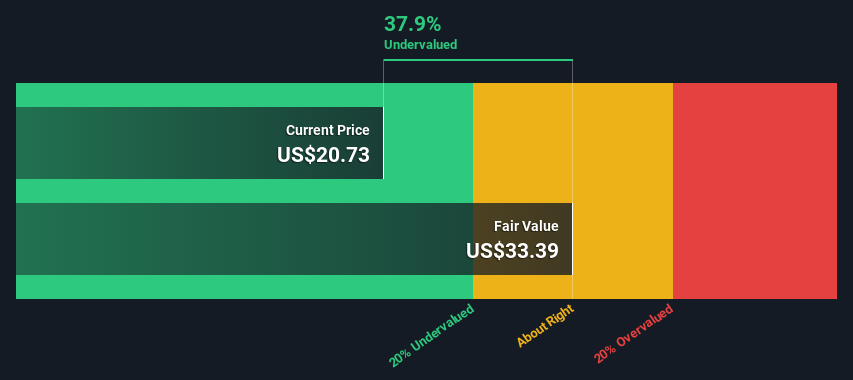
Using the 2 Stage Free Cash Flow to Equity, Lovesac fair value estimate is US$33.39
Current share price of US$20.73 suggests Lovesac is potentially 38% undervalued
Our fair value estimate is 11% lower than Lovesac's analyst price target of US$37.60
Does the April share price for The Lovesac Company (NASDAQ:LOVE) reflect what it's really worth? Today, we will estimate the stock's intrinsic value by projecting its future cash flows and then discounting them to today's value. We will take advantage of the Discounted Cash Flow (DCF) model for this purpose. Don't get put off by the jargon, the math behind it is actually quite straightforward.
We would caution that there are many ways of valuing a company and, like the DCF, each technique has advantages and disadvantages in certain scenarios. If you still have some burning questions about this type of valuation, take a look at the Simply Wall St analysis model.
Check out our latest analysis for Lovesac
Crunching The Numbers
We're using the 2-stage growth model, which simply means we take in account two stages of company's growth. In the initial period the company may have a higher growth rate and the second stage is usually assumed to have a stable growth rate. To start off with, we need to estimate the next ten years of cash flows. Where possible we use analyst estimates, but when these aren't available we extrapolate the previous free cash flow (FCF) from the last estimate or reported value. We assume companies with shrinking free cash flow will slow their rate of shrinkage, and that companies with growing free cash flow will see their growth rate slow, over this period. We do this to reflect that growth tends to slow more in the early years than it does in later years.
Generally we assume that a dollar today is more valuable than a dollar in the future, so we discount the value of these future cash flows to their estimated value in today's dollars:
10-year free cash flow (FCF) estimate
2024 | 2025 | 2026 | 2027 | 2028 | 2029 | 2030 | 2031 | 2032 | 2033 | |
Levered FCF ($, Millions) | US$30.2m | US$13.8m | US$21.5m | US$27.7m | US$33.5m | US$38.7m | US$43.1m | US$46.8m | US$50.0m | US$52.7m |
Growth Rate Estimate Source | Analyst x1 | Analyst x1 | Analyst x1 | Est @ 28.91% | Est @ 20.92% | Est @ 15.33% | Est @ 11.42% | Est @ 8.68% | Est @ 6.76% | Est @ 5.42% |
Present Value ($, Millions) Discounted @ 9.4% | US$27.6 | US$11.5 | US$16.4 | US$19.4 | US$21.4 | US$22.6 | US$23.0 | US$22.8 | US$22.3 | US$21.5 |
("Est" = FCF growth rate estimated by Simply Wall St)
Present Value of 10-year Cash Flow (PVCF) = US$208m
The second stage is also known as Terminal Value, this is the business's cash flow after the first stage. For a number of reasons a very conservative growth rate is used that cannot exceed that of a country's GDP growth. In this case we have used the 5-year average of the 10-year government bond yield (2.3%) to estimate future growth. In the same way as with the 10-year 'growth' period, we discount future cash flows to today's value, using a cost of equity of 9.4%.
Terminal Value (TV)= FCF2033 × (1 + g) ÷ (r – g) = US$53m× (1 + 2.3%) ÷ (9.4%– 2.3%) = US$758m
Present Value of Terminal Value (PVTV)= TV / (1 + r)10= US$758m÷ ( 1 + 9.4%)10= US$309m
The total value, or equity value, is then the sum of the present value of the future cash flows, which in this case is US$517m. The last step is to then divide the equity value by the number of shares outstanding. Relative to the current share price of US$20.7, the company appears quite undervalued at a 38% discount to where the stock price trades currently. The assumptions in any calculation have a big impact on the valuation, so it is better to view this as a rough estimate, not precise down to the last cent.
The Assumptions
Now the most important inputs to a discounted cash flow are the discount rate, and of course, the actual cash flows. If you don't agree with these result, have a go at the calculation yourself and play with the assumptions. The DCF also does not consider the possible cyclicality of an industry, or a company's future capital requirements, so it does not give a full picture of a company's potential performance. Given that we are looking at Lovesac as potential shareholders, the cost of equity is used as the discount rate, rather than the cost of capital (or weighted average cost of capital, WACC) which accounts for debt. In this calculation we've used 9.4%, which is based on a levered beta of 1.545. Beta is a measure of a stock's volatility, compared to the market as a whole. We get our beta from the industry average beta of globally comparable companies, with an imposed limit between 0.8 and 2.0, which is a reasonable range for a stable business.
SWOT Analysis for Lovesac
Strength
Currently debt free.
Weakness
Earnings declined over the past year.
Opportunity
Annual earnings are forecast to grow faster than the American market.
Good value based on P/E ratio and estimated fair value.
Threat
Revenue is forecast to grow slower than 20% per year.
Next Steps:
Although the valuation of a company is important, it shouldn't be the only metric you look at when researching a company. The DCF model is not a perfect stock valuation tool. Rather it should be seen as a guide to "what assumptions need to be true for this stock to be under/overvalued?" For example, changes in the company's cost of equity or the risk free rate can significantly impact the valuation. What is the reason for the share price sitting below the intrinsic value? For Lovesac, there are three essential aspects you should further examine:
Risks: Consider for instance, the ever-present spectre of investment risk. We've identified 1 warning sign with Lovesac , and understanding this should be part of your investment process.
Management:Have insiders been ramping up their shares to take advantage of the market's sentiment for LOVE's future outlook? Check out our management and board analysis with insights on CEO compensation and governance factors.
Other High Quality Alternatives: Do you like a good all-rounder? Explore our interactive list of high quality stocks to get an idea of what else is out there you may be missing!
PS. The Simply Wall St app conducts a discounted cash flow valuation for every stock on the NASDAQGM every day. If you want to find the calculation for other stocks just search here.
Have feedback on this article? Concerned about the content? Get in touch with us directly. Alternatively, email editorial-team (at) simplywallst.com.
This article by Simply Wall St is general in nature. We provide commentary based on historical data and analyst forecasts only using an unbiased methodology and our articles are not intended to be financial advice. It does not constitute a recommendation to buy or sell any stock, and does not take account of your objectives, or your financial situation. We aim to bring you long-term focused analysis driven by fundamental data. Note that our analysis may not factor in the latest price-sensitive company announcements or qualitative material. Simply Wall St has no position in any stocks mentioned.
