
 Yahoo Finance
 LPL Financial (LPLA) Stock Up 3.5% as August Metrics Rise
Shares of LPL Financial Holdings Inc. LPLA rallied 3.5% in response to the release of its monthly assets data. The company’s total brokerage and advisory assets of $1.16 trillion at the end of August 2021 grew 2.4% from the prior month and 40.6% year over year. Of the total assets, brokerage assets were $552.3 billion and advisory assets totaled $604.6 billion.
The increase was mainly driven by the impressive performance of the equity markets and brokerage assets from M&T Bank that onboarded in August.
Total net new assets were $7.6 billion in the reported month. This included $1.3 billion of brokerage assets from M&T Bank that onboarded in the month. Net new assets were $10 billion and $3.1 billion in July 2021 and August 2020, respectively.
LPL Financial reported $49.7 billion of total client cash balance, up 2.5% from July 2021 and 10.2% from August 2020. Of the total balance, $33.2 billion was insured cash and $8.2 billion was deposit cash while the remaining was money-market balance.
Shares of LPL Financial have surged 41.4% so far this year, outperforming 29.1% growth recorded by the industry.
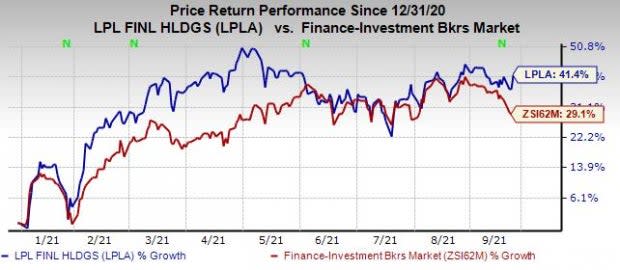
Image Source: Zacks Investment Research
The company currently carries a Zacks Rank #2 (Buy). You can see the complete list of today’s Zacks #1 Rank (Strong Buy) stocks here.
Performance of Other Brokerage Firms
Interactive Brokers Group IBKR released the Electronic Brokerage segment’s performance metrics for August 2021. The segment, which deals with the clearance and settlement of trades for individual and institutional clients globally, reported a 24% year-over-year rise in client Daily Average Revenue Trades to 2,170,000.
Tradeweb Markets Inc. TW reported total trading volume of $19.8 trillion in August 2021. Average daily volumes were $900.4 billion, up 20.6% year over year.
Charles Schwab SCHW reported total client assets of $7.84 trillion in August 2021, up 3% from July 2021 and 75% from August 2020. Client assets receiving ongoing advisory services were $3.88 trillion, up 2% from the prior month and 71% year over year.
Want the latest recommendations from Zacks Investment Research? Today, you can download 7 Best Stocks for the Next 30 Days. Click to get this free report
The Charles Schwab Corporation (SCHW) : Free Stock Analysis Report
Interactive Brokers Group, Inc. (IBKR) : Free Stock Analysis Report
Tradeweb Markets Inc. (TW) : Free Stock Analysis Report
LPL Financial Holdings Inc. (LPLA) : Free Stock Analysis Report
To read this article on Zacks.com click here.
Zacks Investment Research
