
 Yahoo Finance
 What Is Lululemon Athletica's (NASDAQ:LULU) P/E Ratio After Its Share Price Tanked?

Unfortunately for some shareholders, the Lululemon Athletica (NASDAQ:LULU) share price has dived 33% in the last thirty days. Looking back over the last year, the stock has been a solid performer, with a gain of 19%.
All else being equal, a share price drop should make a stock more attractive to potential investors. In the long term, share prices tend to follow earnings per share, but in the short term prices bounce around in response to short term factors (which are not always obvious). The implication here is that long term investors have an opportunity when expectations of a company are too low. Perhaps the simplest way to get a read on investors' expectations of a business is to look at its Price to Earnings Ratio (PE Ratio). A high P/E implies that investors have high expectations of what a company can achieve compared to a company with a low P/E ratio.
Check out our latest analysis for Lululemon Athletica
How Does Lululemon Athletica's P/E Ratio Compare To Its Peers?
We can tell from its P/E ratio of 39.12 that there is some investor optimism about Lululemon Athletica. You can see in the image below that the average P/E (11.6) for companies in the luxury industry is a lot lower than Lululemon Athletica's P/E.
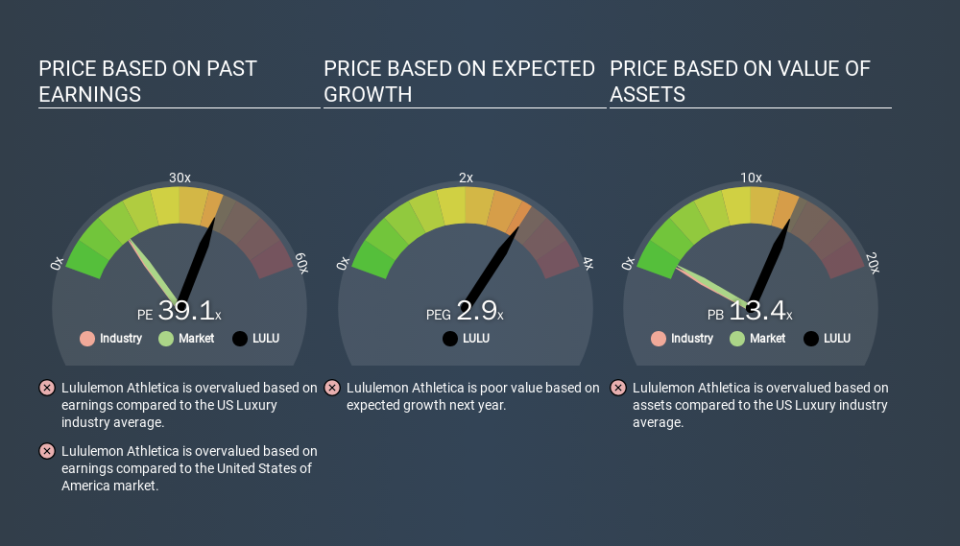
Lululemon Athletica's P/E tells us that market participants think the company will perform better than its industry peers, going forward. Shareholders are clearly optimistic, but the future is always uncertain. So investors should delve deeper. I like to check if company insiders have been buying or selling.
How Growth Rates Impact P/E Ratios
P/E ratios primarily reflect market expectations around earnings growth rates. That's because companies that grow earnings per share quickly will rapidly increase the 'E' in the equation. That means unless the share price increases, the P/E will reduce in a few years. So while a stock may look expensive based on past earnings, it could be cheap based on future earnings.
Lululemon Athletica increased earnings per share by a whopping 49% last year. And earnings per share have improved by 21% annually, over the last five years. So we'd generally expect it to have a relatively high P/E ratio.
A Limitation: P/E Ratios Ignore Debt and Cash In The Bank
The 'Price' in P/E reflects the market capitalization of the company. In other words, it does not consider any debt or cash that the company may have on the balance sheet. The exact same company would hypothetically deserve a higher P/E ratio if it had a strong balance sheet, than if it had a weak one with lots of debt, because a cashed up company can spend on growth.
While growth expenditure doesn't always pay off, the point is that it is a good option to have; but one that the P/E ratio ignores.
How Does Lululemon Athletica's Debt Impact Its P/E Ratio?
Since Lululemon Athletica holds net cash of US$586m, it can spend on growth, justifying a higher P/E ratio than otherwise.
The Verdict On Lululemon Athletica's P/E Ratio
Lululemon Athletica's P/E is 39.1 which is above average (13.3) in its market. Its net cash position is the cherry on top of its superb EPS growth. To us, this is the sort of company that we would expect to carry an above average price tag (relative to earnings). What can be absolutely certain is that the market has become significantly less optimistic about Lululemon Athletica over the last month, with the P/E ratio falling from 58.7 back then to 39.1 today. For those who prefer to invest with the flow of momentum, that might be a bad sign, but for a contrarian, it may signal opportunity.
When the market is wrong about a stock, it gives savvy investors an opportunity. People often underestimate remarkable growth -- so investors can make money when fast growth is not fully appreciated. So this free report on the analyst consensus forecasts could help you make a master move on this stock.
You might be able to find a better buy than Lululemon Athletica. If you want a selection of possible winners, check out this free list of interesting companies that trade on a P/E below 20 (but have proven they can grow earnings).
If you spot an error that warrants correction, please contact the editor at editorial-team@simplywallst.com. This article by Simply Wall St is general in nature. It does not constitute a recommendation to buy or sell any stock, and does not take account of your objectives, or your financial situation. Simply Wall St has no position in the stocks mentioned.
We aim to bring you long-term focused research analysis driven by fundamental data. Note that our analysis may not factor in the latest price-sensitive company announcements or qualitative material. Thank you for reading.
