
 Yahoo Finance
 Can Luxottica Group SpA’s (BIT:LUX) ROE Continue To Surpass The Industry Average?

While some investors are already well versed in financial metrics (hat tip), this article is for those who would like to learn about Return On Equity (ROE) and why it is important. To keep the lesson grounded in practicality, we’ll use ROE to better understand Luxottica Group SpA (BIT:LUX).
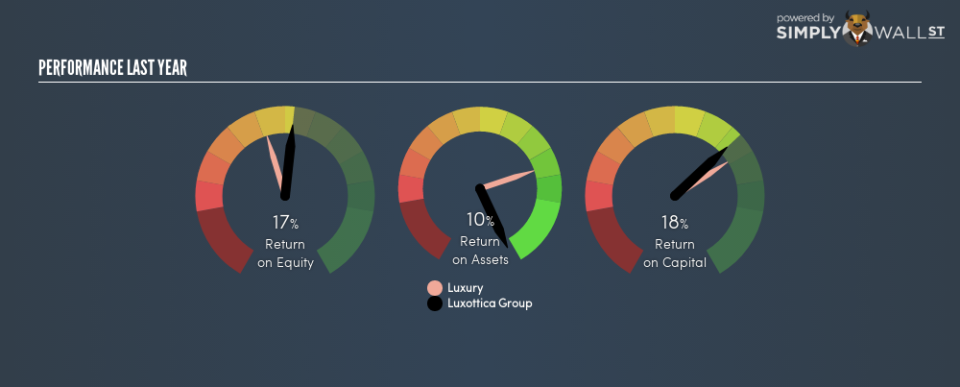
Luxottica Group has a ROE of 17%, based on the last twelve months. One way to conceptualize this, is that for each €1 of shareholders’ equity it has, the company made €0.17 in profit.
Check out our latest analysis for Luxottica Group
How Do You Calculate Return On Equity?
The formula for return on equity is:
Return on Equity = Net Profit ÷ Shareholders’ Equity
Or for Luxottica Group:
17% = 1006.595 ÷ €5.9b (Based on the trailing twelve months to June 2018.)
It’s easy to understand the ‘net profit’ part of that equation, but ‘shareholders’ equity’ requires further explanation. It is all earnings retained by the company, plus any capital paid in by shareholders. The easiest way to calculate shareholders’ equity is to subtract the company’s total liabilities from the total assets.
What Does Return On Equity Signify?
Return on Equity measures a company’s profitability against the profit it has kept for the business (plus any capital injections). The ‘return’ is the profit over the last twelve months. The higher the ROE, the more profit the company is making. So, all else equal, investors should like a high ROE. That means it can be interesting to compare the ROE of different companies.
Does Luxottica Group Have A Good Return On Equity?
By comparing a company’s ROE with its industry average, we can get a quick measure of how good it is. However, this method is only useful as a rough check, because companies do differ quite a bit within the same industry classification. As you can see in the graphic below, Luxottica Group has a higher ROE than the average (13%) in the luxury industry.
That’s what I like to see. In my book, a high ROE almost always warrants a closer look. One data point to check is if insiders have bought shares recently.
How Does Debt Impact Return On Equity?
Virtually all companies need money to invest in the business, to grow profits. The cash for investment can come from prior year profits (retained earnings), issuing new shares, or borrowing. In the case of the first and second options, the ROE will reflect this use of cash, for growth. In the latter case, the use of debt will improve the returns, but will not change the equity. That will make the ROE look better than if no debt was used.
Luxottica Group’s Debt And Its 17% ROE
Luxottica Group has a debt to equity ratio of 0.32, which is far from excessive. Its very respectable ROE, combined with only modest debt, suggests the business is in good shape. Careful use of debt to boost returns is often very good for shareholders. However, it could reduce the company’s ability to take advantage of future opportunities.
The Key Takeaway
Return on equity is one way we can compare the business quality of different companies. In my book the highest quality companies have high return on equity, despite low debt. If two companies have around the same level of debt to equity, and one has a higher ROE, I’d generally prefer the one with higher ROE.
But when a business is high quality, the market often bids it up to a price that reflects this. It is important to consider other factors, such as future profit growth — and how much investment is required going forward. So you might want to take a peek at this data-rich interactive graph of forecasts for the company.
Of course, you might find a fantastic investment by looking elsewhere. So take a peek at this free list of interesting companies.
To help readers see past the short term volatility of the financial market, we aim to bring you a long-term focused research analysis purely driven by fundamental data. Note that our analysis does not factor in the latest price-sensitive company announcements.
The author is an independent contributor and at the time of publication had no position in the stocks mentioned. For errors that warrant correction please contact the editor at editorial-team@simplywallst.com.
