
 Yahoo Finance
 M Winkworth's (LON:WINK) Dividend Will Be £0.03
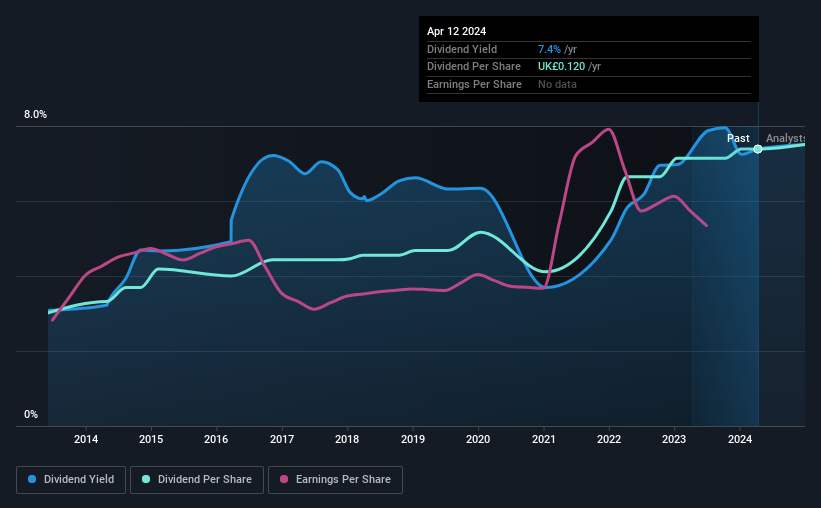
M Winkworth PLC (LON:WINK) has announced that it will pay a dividend of £0.03 per share on the 16th of May. The dividend yield will be 7.4% based on this payment which is still above the industry average.
View our latest analysis for M Winkworth
M Winkworth's Earnings Easily Cover The Distributions
If the payments aren't sustainable, a high yield for a few years won't matter that much. The last payment made up 85% of earnings, but cash flows were much higher. In general, cash flows are more important than earnings, so we are comfortable that the dividend will be sustainable going forward, especially with so much cash left over for reinvestment.
Earnings per share could rise by 8.2% over the next year if things go the same way as they have for the last few years. Assuming the dividend continues along recent trends, our estimates say the payout ratio could reach 89%, which is definitely on the higher side, but we wouldn't necessarily say this is unsustainable.
Dividend Volatility
The company's dividend history has been marked by instability, with at least one cut in the last 10 years. The annual payment during the last 10 years was £0.049 in 2014, and the most recent fiscal year payment was £0.12. This works out to be a compound annual growth rate (CAGR) of approximately 9.4% a year over that time. We like to see dividends have grown at a reasonable rate, but with at least one substantial cut in the payments, we're not certain this dividend stock would be ideal for someone intending to live on the income.
We Could See M Winkworth's Dividend Growing
Given that the dividend has been cut in the past, we need to check if earnings are growing and if that might lead to stronger dividends in the future. M Winkworth has impressed us by growing EPS at 8.2% per year over the past five years. Past earnings growth has been decent, but unless this is one of those rare businesses that can grow without additional capital investment or marketing spend, we'd generally expect the higher payout ratio to limit its future growth prospects.
Our Thoughts On M Winkworth's Dividend
In summary, while it's good to see that the dividend hasn't been cut, we are a bit cautious about M Winkworth's payments, as there could be some issues with sustaining them into the future. The company is generating plenty of cash, which could maintain the dividend for a while, but the track record hasn't been great. We would probably look elsewhere for an income investment.
Market movements attest to how highly valued a consistent dividend policy is compared to one which is more unpredictable. Still, investors need to consider a host of other factors, apart from dividend payments, when analysing a company. As an example, we've identified 3 warning signs for M Winkworth that you should be aware of before investing. Is M Winkworth not quite the opportunity you were looking for? Why not check out our selection of top dividend stocks.
Have feedback on this article? Concerned about the content? Get in touch with us directly. Alternatively, email editorial-team (at) simplywallst.com.
This article by Simply Wall St is general in nature. We provide commentary based on historical data and analyst forecasts only using an unbiased methodology and our articles are not intended to be financial advice. It does not constitute a recommendation to buy or sell any stock, and does not take account of your objectives, or your financial situation. We aim to bring you long-term focused analysis driven by fundamental data. Note that our analysis may not factor in the latest price-sensitive company announcements or qualitative material. Simply Wall St has no position in any stocks mentioned.
