
 Yahoo Finance
 Macro Enterprises (CVE:MCR) Is Doing The Right Things To Multiply Its Share Price
If you're not sure where to start when looking for the next multi-bagger, there are a few key trends you should keep an eye out for. One common approach is to try and find a company with returns on capital employed (ROCE) that are increasing, in conjunction with a growing amount of capital employed. Ultimately, this demonstrates that it's a business that is reinvesting profits at increasing rates of return. So on that note, Macro Enterprises (CVE:MCR) looks quite promising in regards to its trends of return on capital.
What is Return On Capital Employed (ROCE)?
For those that aren't sure what ROCE is, it measures the amount of pre-tax profits a company can generate from the capital employed in its business. To calculate this metric for Macro Enterprises, this is the formula:
Return on Capital Employed = Earnings Before Interest and Tax (EBIT) ÷ (Total Assets - Current Liabilities)
0.20 = CA$28m ÷ (CA$193m - CA$52m) (Based on the trailing twelve months to June 2021).
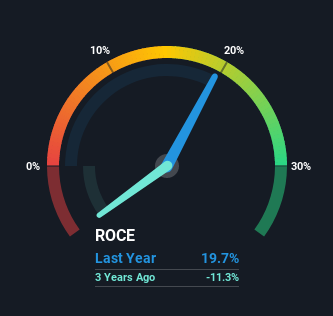
So, Macro Enterprises has an ROCE of 20%. In absolute terms, that's a satisfactory return, but compared to the Energy Services industry average of 2.6% it's much better.
Check out our latest analysis for Macro Enterprises
Above you can see how the current ROCE for Macro Enterprises compares to its prior returns on capital, but there's only so much you can tell from the past. If you'd like, you can check out the forecasts from the analysts covering Macro Enterprises here for free.
What Does the ROCE Trend For Macro Enterprises Tell Us?
The fact that Macro Enterprises is now generating some pre-tax profits from its prior investments is very encouraging. The company was generating losses five years ago, but now it's earning 20% which is a sight for sore eyes. In addition to that, Macro Enterprises is employing 53% more capital than previously which is expected of a company that's trying to break into profitability. This can indicate that there's plenty of opportunities to invest capital internally and at ever higher rates, both common traits of a multi-bagger.
For the record though, there was a noticeable increase in the company's current liabilities over the period, so we would attribute some of the ROCE growth to that. Essentially the business now has suppliers or short-term creditors funding about 27% of its operations, which isn't ideal. Keep an eye out for future increases because when the ratio of current liabilities to total assets gets particularly high, this can introduce some new risks for the business.
In Conclusion...
Overall, Macro Enterprises gets a big tick from us thanks in most part to the fact that it is now profitable and is reinvesting in its business. And with a respectable 70% awarded to those who held the stock over the last five years, you could argue that these developments are starting to get the attention they deserve. Therefore, we think it would be worth your time to check if these trends are going to continue.
Like most companies, Macro Enterprises does come with some risks, and we've found 1 warning sign that you should be aware of.
While Macro Enterprises isn't earning the highest return, check out this free list of companies that are earning high returns on equity with solid balance sheets.
This article by Simply Wall St is general in nature. We provide commentary based on historical data and analyst forecasts only using an unbiased methodology and our articles are not intended to be financial advice. It does not constitute a recommendation to buy or sell any stock, and does not take account of your objectives, or your financial situation. We aim to bring you long-term focused analysis driven by fundamental data. Note that our analysis may not factor in the latest price-sensitive company announcements or qualitative material. Simply Wall St has no position in any stocks mentioned.
Have feedback on this article? Concerned about the content? Get in touch with us directly. Alternatively, email editorial-team (at) simplywallst.com.
