
 Yahoo Finance
 Malayan Cement Berhad (KLSE:MCEMENT) Is Experiencing Growth In Returns On Capital
If you're not sure where to start when looking for the next multi-bagger, there are a few key trends you should keep an eye out for. Typically, we'll want to notice a trend of growing return on capital employed (ROCE) and alongside that, an expanding base of capital employed. If you see this, it typically means it's a company with a great business model and plenty of profitable reinvestment opportunities. So when we looked at Malayan Cement Berhad (KLSE:MCEMENT) and its trend of ROCE, we really liked what we saw.
What Is Return On Capital Employed (ROCE)?
If you haven't worked with ROCE before, it measures the 'return' (pre-tax profit) a company generates from capital employed in its business. The formula for this calculation on Malayan Cement Berhad is:
Return on Capital Employed = Earnings Before Interest and Tax (EBIT) ÷ (Total Assets - Current Liabilities)
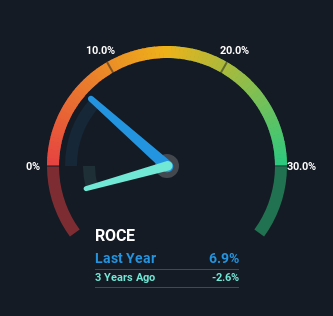
0.069 = RM641m ÷ (RM11b - RM1.5b) (Based on the trailing twelve months to December 2023).
Therefore, Malayan Cement Berhad has an ROCE of 6.9%. On its own that's a low return, but compared to the average of 5.6% generated by the Basic Materials industry, it's much better.
View our latest analysis for Malayan Cement Berhad
Above you can see how the current ROCE for Malayan Cement Berhad compares to its prior returns on capital, but there's only so much you can tell from the past. If you'd like, you can check out the forecasts from the analysts covering Malayan Cement Berhad for free.
The Trend Of ROCE
We're delighted to see that Malayan Cement Berhad is reaping rewards from its investments and is now generating some pre-tax profits. Shareholders would no doubt be pleased with this because the business was loss-making five years ago but is is now generating 6.9% on its capital. In addition to that, Malayan Cement Berhad is employing 208% more capital than previously which is expected of a company that's trying to break into profitability. This can tell us that the company has plenty of reinvestment opportunities that are able to generate higher returns.
One more thing to note, Malayan Cement Berhad has decreased current liabilities to 14% of total assets over this period, which effectively reduces the amount of funding from suppliers or short-term creditors. So shareholders would be pleased that the growth in returns has mostly come from underlying business performance.
Our Take On Malayan Cement Berhad's ROCE
To the delight of most shareholders, Malayan Cement Berhad has now broken into profitability. Since the stock has only returned 39% to shareholders over the last five years, the promising fundamentals may not be recognized yet by investors. So exploring more about this stock could uncover a good opportunity, if the valuation and other metrics stack up.
On a separate note, we've found 1 warning sign for Malayan Cement Berhad you'll probably want to know about.
If you want to search for solid companies with great earnings, check out this free list of companies with good balance sheets and impressive returns on equity.
Have feedback on this article? Concerned about the content? Get in touch with us directly. Alternatively, email editorial-team (at) simplywallst.com.
This article by Simply Wall St is general in nature. We provide commentary based on historical data and analyst forecasts only using an unbiased methodology and our articles are not intended to be financial advice. It does not constitute a recommendation to buy or sell any stock, and does not take account of your objectives, or your financial situation. We aim to bring you long-term focused analysis driven by fundamental data. Note that our analysis may not factor in the latest price-sensitive company announcements or qualitative material. Simply Wall St has no position in any stocks mentioned.
