
 Yahoo Finance
 How Many Aon plc (NYSE:AON) Shares Do Institutions Own?

The big shareholder groups in Aon plc (NYSE:AON) have power over the company. Insiders often own a large chunk of younger, smaller, companies while huge companies tend to have institutions as shareholders. We also tend to see lower insider ownership in companies that were previously publicly owned.
With a market capitalization of US$44b, Aon is rather large. We'd expect to see institutional investors on the register. Companies of this size are usually well known to retail investors, too. In the chart below below, we can see that institutions own shares in the company. Let's take a closer look to see what the different types of shareholder can tell us about AON.
View our latest analysis for Aon

What Does The Institutional Ownership Tell Us About Aon?
Institutional investors commonly compare their own returns to the returns of a commonly followed index. So they generally do consider buying larger companies that are included in the relevant benchmark index.
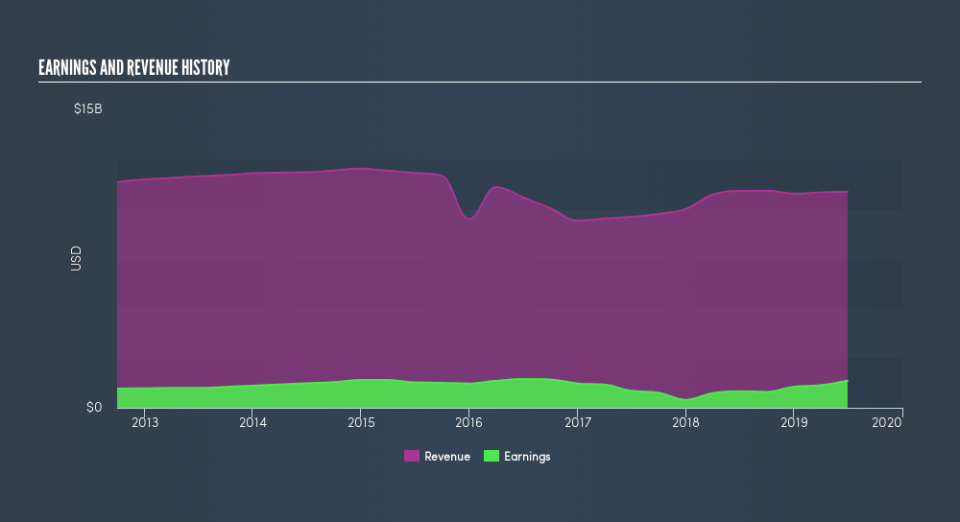
As you can see, institutional investors own 89% of Aon. This implies the analysts working for those institutions have looked at the stock and they like it. But just like anyone else, they could be wrong. It is not uncommon to see a big share price drop if two large institutional investors try to sell out of a stock at the same time. So it is worth checking the past earnings trajectory of Aon, (below). Of course, keep in mind that there are other factors to consider, too.
Since institutional investors own more than half the issued stock, the board will likely have to pay attention to their preferences. Aon is not owned by hedge funds. There are a reasonable number of analysts covering the stock, so it might be useful to find out their aggregate view on the future.
Insider Ownership Of Aon
The definition of company insiders can be subjective, and does vary between jurisdictions. Our data reflects individual insiders, capturing board members at the very least. The company management answer to the board; and the latter should represent the interests of shareholders. Notably, sometimes top-level managers are on the board, themselves.
Most consider insider ownership a positive because it can indicate the board is well aligned with other shareholders. However, on some occasions too much power is concentrated within this group.
I can report that insiders do own shares in Aon plc. Insiders own US$509m worth of shares (at current prices). It is good to see this level of investment. You can check here to see if those insiders have been buying recently.
General Public Ownership
The general public holds a 10% stake in AON. This size of ownership, while considerable, may not be enough to change company policy if the decision is not in sync with other large shareholders.
Next Steps:
I find it very interesting to look at who exactly owns a company. But to truly gain insight, we need to consider other information, too.
Many find it useful to take an in depth look at how a company has performed in the past. You can access this detailed graph of past earnings, revenue and cash flow .
If you would prefer discover what analysts are predicting in terms of future growth, do not miss this free report on analyst forecasts.
NB: Figures in this article are calculated using data from the last twelve months, which refer to the 12-month period ending on the last date of the month the financial statement is dated. This may not be consistent with full year annual report figures.
We aim to bring you long-term focused research analysis driven by fundamental data. Note that our analysis may not factor in the latest price-sensitive company announcements or qualitative material.
If you spot an error that warrants correction, please contact the editor at editorial-team@simplywallst.com. This article by Simply Wall St is general in nature. It does not constitute a recommendation to buy or sell any stock, and does not take account of your objectives, or your financial situation. Simply Wall St has no position in the stocks mentioned. Thank you for reading.
