
 Yahoo Finance
 Many Still Looking Away From Orascom Development Holding AG (VTX:ODHN)
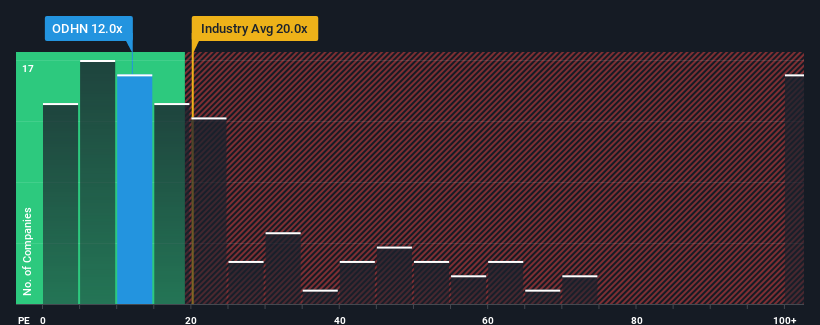
When close to half the companies in Switzerland have price-to-earnings ratios (or "P/E's") above 20x, you may consider Orascom Development Holding AG (VTX:ODHN) as an attractive investment with its 12x P/E ratio. Nonetheless, we'd need to dig a little deeper to determine if there is a rational basis for the reduced P/E.
Orascom Development Holding certainly has been doing a good job lately as its earnings growth has been positive while most other companies have been seeing their earnings go backwards. It might be that many expect the strong earnings performance to degrade substantially, possibly more than the market, which has repressed the P/E. If not, then existing shareholders have reason to be quite optimistic about the future direction of the share price.
View our latest analysis for Orascom Development Holding
Want the full picture on analyst estimates for the company? Then our free report on Orascom Development Holding will help you uncover what's on the horizon.
How Is Orascom Development Holding's Growth Trending?
Orascom Development Holding's P/E ratio would be typical for a company that's only expected to deliver limited growth, and importantly, perform worse than the market.
Taking a look back first, we see that there was hardly any earnings per share growth to speak of for the company over the past year. Likewise, not much has changed from three years ago as earnings have been stuck during that whole time. Therefore, it's fair to say that earnings growth has definitely eluded the company recently.
Turning to the outlook, the next year should generate growth of 100% as estimated by the sole analyst watching the company. Meanwhile, the rest of the market is forecast to only expand by 11%, which is noticeably less attractive.
In light of this, it's peculiar that Orascom Development Holding's P/E sits below the majority of other companies. Apparently some shareholders are doubtful of the forecasts and have been accepting significantly lower selling prices.
What We Can Learn From Orascom Development Holding's P/E?
It's argued the price-to-earnings ratio is an inferior measure of value within certain industries, but it can be a powerful business sentiment indicator.
We've established that Orascom Development Holding currently trades on a much lower than expected P/E since its forecast growth is higher than the wider market. When we see a strong earnings outlook with faster-than-market growth, we assume potential risks are what might be placing significant pressure on the P/E ratio. It appears many are indeed anticipating earnings instability, because these conditions should normally provide a boost to the share price.
It is also worth noting that we have found 1 warning sign for Orascom Development Holding that you need to take into consideration.
Of course, you might also be able to find a better stock than Orascom Development Holding. So you may wish to see this free collection of other companies that have reasonable P/E ratios and have grown earnings strongly.
Have feedback on this article? Concerned about the content? Get in touch with us directly. Alternatively, email editorial-team (at) simplywallst.com.
This article by Simply Wall St is general in nature. We provide commentary based on historical data and analyst forecasts only using an unbiased methodology and our articles are not intended to be financial advice. It does not constitute a recommendation to buy or sell any stock, and does not take account of your objectives, or your financial situation. We aim to bring you long-term focused analysis driven by fundamental data. Note that our analysis may not factor in the latest price-sensitive company announcements or qualitative material. Simply Wall St has no position in any stocks mentioned.
Join A Paid User Research Session
You’ll receive a US$30 Amazon Gift card for 1 hour of your time while helping us build better investing tools for the individual investors like yourself. Sign up here
