
 Yahoo Finance
 Market Cool On Pebble Beach Systems Group plc's (LON:PEB) Earnings

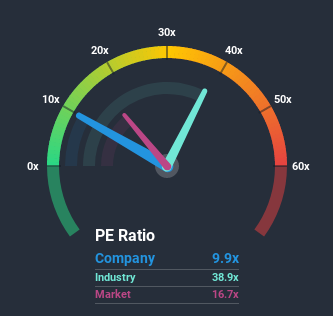
With a price-to-earnings (or "P/E") ratio of 9.9x Pebble Beach Systems Group plc (LON:PEB) may be sending bullish signals at the moment, given that almost half of all companies in the United Kingdom have P/E ratios greater than 17x and even P/E's higher than 36x are not unusual. However, the P/E might be low for a reason and it requires further investigation to determine if it's justified.
The recent earnings growth at Pebble Beach Systems Group would have to be considered satisfactory if not spectacular. One possibility is that the P/E is low because investors think this good earnings growth might actually underperform the broader market in the near future. If you like the company, you'd be hoping this isn't the case so that you could potentially pick up some stock while it's out of favour.
Check out our latest analysis for Pebble Beach Systems Group
Want the full picture on earnings, revenue and cash flow for the company? Then our free report on Pebble Beach Systems Group will help you shine a light on its historical performance.
What Are Growth Metrics Telling Us About The Low P/E?
Pebble Beach Systems Group's P/E ratio would be typical for a company that's only expected to deliver limited growth, and importantly, perform worse than the market.
Retrospectively, the last year delivered a decent 5.8% gain to the company's bottom line. Still, EPS has barely risen at all in aggregate from three years ago, which is not ideal. So it appears to us that the company has had a mixed result in terms of growing earnings over that time.
Weighing the recent medium-term upward earnings trajectory against the broader market's one-year forecast for contraction of 3.0% shows it's a great look while it lasts.
In light of this, it's quite peculiar that Pebble Beach Systems Group's P/E sits below the majority of other companies. It looks like most investors are not convinced at all that the company can maintain its recent positive growth rate in the face of a shrinking broader market.
The Key Takeaway
While the price-to-earnings ratio shouldn't be the defining factor in whether you buy a stock or not, it's quite a capable barometer of earnings expectations.
We've established that Pebble Beach Systems Group currently trades on a much lower than expected P/E since its recent three-year earnings growth is beating forecasts for a struggling market. There could be some major unobserved threats to earnings preventing the P/E ratio from matching this positive performance. Perhaps there is some hesitation about the company's ability to stay its recent course and swim against the current of the broader market turmoil. It appears many are indeed anticipating earnings instability, because this relative performance should normally provide a boost to the share price.
It is also worth noting that we have found 2 warning signs for Pebble Beach Systems Group that you need to take into consideration.
Of course, you might find a fantastic investment by looking at a few good candidates. So take a peek at this free list of companies with a strong growth track record, trading on a P/E below 20x.
This article by Simply Wall St is general in nature. It does not constitute a recommendation to buy or sell any stock, and does not take account of your objectives, or your financial situation. We aim to bring you long-term focused analysis driven by fundamental data. Note that our analysis may not factor in the latest price-sensitive company announcements or qualitative material. Simply Wall St has no position in any stocks mentioned.
Have feedback on this article? Concerned about the content? Get in touch with us directly. Alternatively, email editorial-team@simplywallst.com.
