
 Yahoo Finance
 Market Participants Recognise The Fulham Shore PLC's (LON:FUL) Earnings Pushing Shares 27% Higher
The Fulham Shore PLC (LON:FUL) shares have continued their recent momentum with a 27% gain in the last month alone. Unfortunately, the gains of the last month did little to right the losses of the last year with the stock still down 20% over that time.
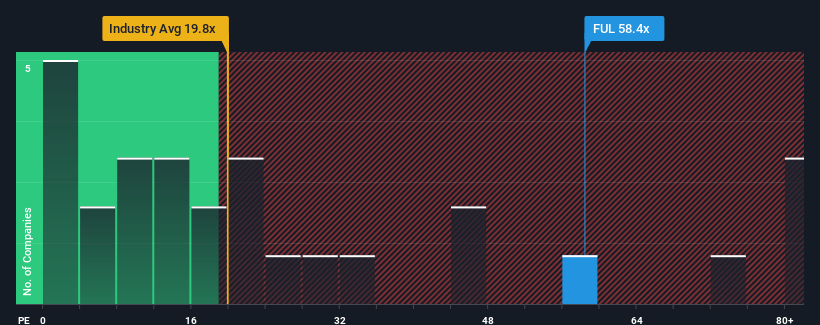
Following the firm bounce in price, Fulham Shore's price-to-earnings (or "P/E") ratio of 58.4x might make it look like a strong sell right now compared to the market in the United Kingdom, where around half of the companies have P/E ratios below 13x and even P/E's below 7x are quite common. Nonetheless, we'd need to dig a little deeper to determine if there is a rational basis for the highly elevated P/E.
With earnings growth that's superior to most other companies of late, Fulham Shore has been doing relatively well. The P/E is probably high because investors think this strong earnings performance will continue. If not, then existing shareholders might be a little nervous about the viability of the share price.
See our latest analysis for Fulham Shore
If you'd like to see what analysts are forecasting going forward, you should check out our free report on Fulham Shore.
How Is Fulham Shore's Growth Trending?
There's an inherent assumption that a company should far outperform the market for P/E ratios like Fulham Shore's to be considered reasonable.
If we review the last year of earnings growth, the company posted a terrific increase of 10,804%. The latest three year period has also seen an excellent 837% overall rise in EPS, aided by its short-term performance. So we can start by confirming that the company has done a great job of growing earnings over that time.
Turning to the outlook, the next three years should generate growth of 32% per year as estimated by the four analysts watching the company. That's shaping up to be materially higher than the 11% each year growth forecast for the broader market.
In light of this, it's understandable that Fulham Shore's P/E sits above the majority of other companies. It seems most investors are expecting this strong future growth and are willing to pay more for the stock.
What We Can Learn From Fulham Shore's P/E?
Shares in Fulham Shore have built up some good momentum lately, which has really inflated its P/E. We'd say the price-to-earnings ratio's power isn't primarily as a valuation instrument but rather to gauge current investor sentiment and future expectations.
As we suspected, our examination of Fulham Shore's analyst forecasts revealed that its superior earnings outlook is contributing to its high P/E. At this stage investors feel the potential for a deterioration in earnings isn't great enough to justify a lower P/E ratio. It's hard to see the share price falling strongly in the near future under these circumstances.
You always need to take note of risks, for example - Fulham Shore has 2 warning signs we think you should be aware of.
Of course, you might also be able to find a better stock than Fulham Shore. So you may wish to see this free collection of other companies that have reasonable P/E ratios and have grown earnings strongly.
Have feedback on this article? Concerned about the content? Get in touch with us directly. Alternatively, email editorial-team (at) simplywallst.com.
This article by Simply Wall St is general in nature. We provide commentary based on historical data and analyst forecasts only using an unbiased methodology and our articles are not intended to be financial advice. It does not constitute a recommendation to buy or sell any stock, and does not take account of your objectives, or your financial situation. We aim to bring you long-term focused analysis driven by fundamental data. Note that our analysis may not factor in the latest price-sensitive company announcements or qualitative material. Simply Wall St has no position in any stocks mentioned.
Join A Paid User Research Session
You’ll receive a US$30 Amazon Gift card for 1 hour of your time while helping us build better investing tools for the individual investors like yourself. Sign up here
