
 Yahoo Finance
 Market Participants Recognise Rocket Lab USA, Inc.'s (NASDAQ:RKLB) Revenues
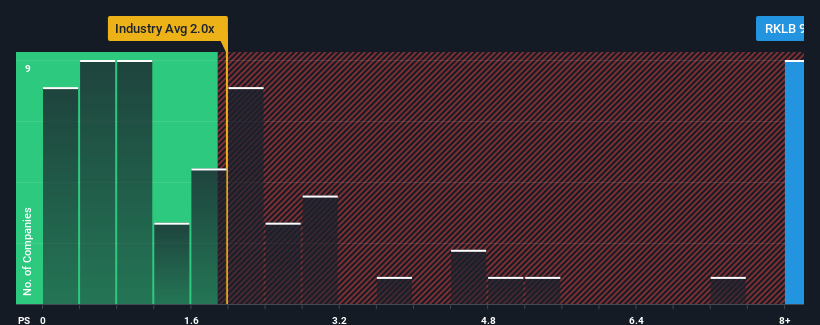
Rocket Lab USA, Inc.'s (NASDAQ:RKLB) price-to-sales (or "P/S") ratio of 9.4x may look like a poor investment opportunity when you consider close to half the companies in the Aerospace & Defense industry in the United States have P/S ratios below 2x. Although, it's not wise to just take the P/S at face value as there may be an explanation why it's so lofty.
Check out our latest analysis for Rocket Lab USA
What Does Rocket Lab USA's P/S Mean For Shareholders?
With revenue growth that's superior to most other companies of late, Rocket Lab USA has been doing relatively well. It seems the market expects this form will continue into the future, hence the elevated P/S ratio. You'd really hope so, otherwise you're paying a pretty hefty price for no particular reason.
Want the full picture on analyst estimates for the company? Then our free report on Rocket Lab USA will help you uncover what's on the horizon.
How Is Rocket Lab USA's Revenue Growth Trending?
Rocket Lab USA's P/S ratio would be typical for a company that's expected to deliver very strong growth, and importantly, perform much better than the industry.
If we review the last year of revenue growth, the company posted a terrific increase of 239%. The latest three year period has also seen an incredible overall rise in revenue, aided by its incredible short-term performance. Accordingly, shareholders would have been over the moon with those medium-term rates of revenue growth.
Turning to the outlook, the next three years should generate growth of 49% per year as estimated by the eight analysts watching the company. Meanwhile, the rest of the industry is forecast to only expand by 9.0% per annum, which is noticeably less attractive.
In light of this, it's understandable that Rocket Lab USA's P/S sits above the majority of other companies. It seems most investors are expecting this strong future growth and are willing to pay more for the stock.
The Key Takeaway
Typically, we'd caution against reading too much into price-to-sales ratios when settling on investment decisions, though it can reveal plenty about what other market participants think about the company.
Our look into Rocket Lab USA shows that its P/S ratio remains high on the merit of its strong future revenues. It appears that shareholders are confident in the company's future revenues, which is propping up the P/S. Unless these conditions change, they will continue to provide strong support to the share price.
Don't forget that there may be other risks. For instance, we've identified 2 warning signs for Rocket Lab USA that you should be aware of.
It's important to make sure you look for a great company, not just the first idea you come across. So if growing profitability aligns with your idea of a great company, take a peek at this free list of interesting companies with strong recent earnings growth (and a low P/E).
Have feedback on this article? Concerned about the content? Get in touch with us directly. Alternatively, email editorial-team (at) simplywallst.com.
This article by Simply Wall St is general in nature. We provide commentary based on historical data and analyst forecasts only using an unbiased methodology and our articles are not intended to be financial advice. It does not constitute a recommendation to buy or sell any stock, and does not take account of your objectives, or your financial situation. We aim to bring you long-term focused analysis driven by fundamental data. Note that our analysis may not factor in the latest price-sensitive company announcements or qualitative material. Simply Wall St has no position in any stocks mentioned.
Join A Paid User Research Session
You’ll receive a US$30 Amazon Gift card for 1 hour of your time while helping us build better investing tools for the individual investors like yourself. Sign up here
